Your graphics add a nice touch to my presentations and I recently used them for one of my all-hands meetings. Your toolbox adds professionalism to my slides. Instead of using standard clipart.
Claude Jones, Director of Engineer, @Walmartlabs, USA
Your graphics add a nice touch to my presentations and I recently used them for one of my all-hands meetings. Your toolbox adds professionalism to my slides. Instead of using standard clipart.
Claude Jones, Director of Engineer, @Walmartlabs, USA
I needed a fresh look at some of my slides. I've tried to find a way to create a paintbrush effect, to underline, accentuate, add some color and the handwritten markers were just the things. Very easy to use, easy to size, change the color. It was an affordable, perfect solution and I'm happy to recommend it.
Anonymous, US
The crisp, clean look of the graphics, and the fact that it allowed me to easily edit and change the colors to match the template was my main reason for purchasing them.
Brandie Jenkins, E-learning Developer, USA
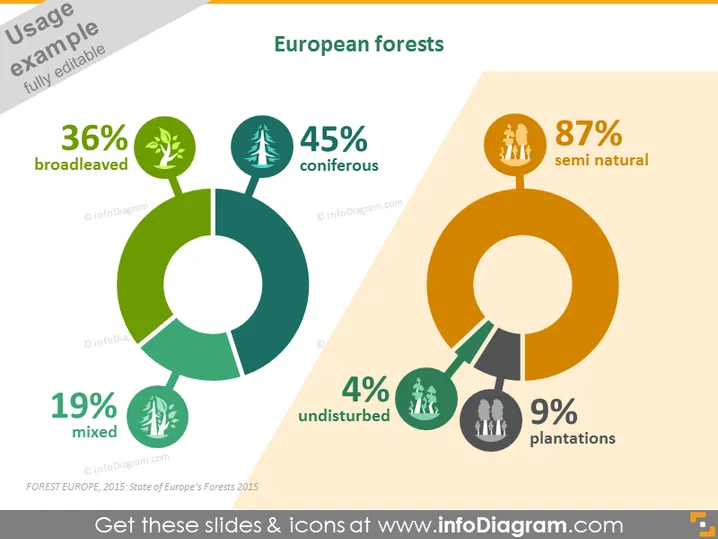
The slide presents statistics about European forests, broken down into categories with corresponding percentages. The "36% broadleaved" suggests that a significant portion of Europe's forests consists of broadleaved trees, indicating a variety of tree species that are deciduous. The "45% coniferous" implies that nearly half of the forests are made up of coniferous trees, which are typically evergreens with needle-like leaves. "19% mixed" points to areas where broadleaved and coniferous trees coexist, offering diverse habitats. The "4% undisturbed" indicates a small portion of forests that remain in their natural state without significant human interference. The "87% semi natural" informs us that the majority of forests have some level of natural characteristics but may have been influenced by human activities. Lastly, "9% plantations" show that a smaller fraction of forests is dedicated to systematically planted trees, often for commercial purposes.
The slide has a clean, professional look with a focus on clarity and easy interpretation of data. The contrasting colors and simple icons help convey the information quickly and effectively.


