Your graphics add a nice touch to my presentations and I recently used them for one of my all-hands meetings. Your toolbox adds professionalism to my slides. Instead of using standard clipart.
Claude Jones, Director of Engineer, @Walmartlabs, USA
Your graphics add a nice touch to my presentations and I recently used them for one of my all-hands meetings. Your toolbox adds professionalism to my slides. Instead of using standard clipart.
Claude Jones, Director of Engineer, @Walmartlabs, USA
I needed a fresh look at some of my slides. I've tried to find a way to create a paintbrush effect, to underline, accentuate, add some color and the handwritten markers were just the things. Very easy to use, easy to size, change the color. It was an affordable, perfect solution and I'm happy to recommend it.
Anonymous, US
The crisp, clean look of the graphics, and the fact that it allowed me to easily edit and change the colors to match the template was my main reason for purchasing them.
Brandie Jenkins, E-learning Developer, USA
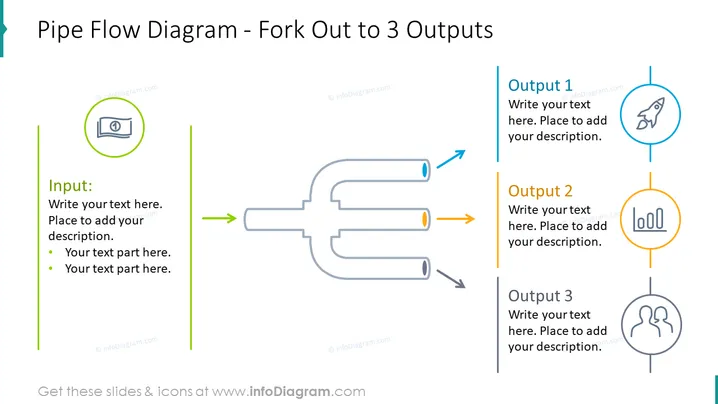
The slide depicts a "Pipe Flow Diagram" splitting from one input into three separate outputs. The input section allows for a detailed description, signifying some form of initial resource or data. Each of the three outputs is accompanied by space for text and descriptions, suggesting a representation of different results or categories that stem from the single input. The labels "Input," "Output 1," "Output 2," and "Output 3" are placeholders for specific user-defined content.
The slide displays a clean and professional design with a color-coded scheme that provides visual differentiation between the inputs and outputs. Icons within circles are used to represent different outputs or categories.


