Your graphics add a nice touch to my presentations and I recently used them for one of my all-hands meetings. Your toolbox adds professionalism to my slides. Instead of using standard clipart.
Claude Jones, Director of Engineer, @Walmartlabs, USA
Your graphics add a nice touch to my presentations and I recently used them for one of my all-hands meetings. Your toolbox adds professionalism to my slides. Instead of using standard clipart.
Claude Jones, Director of Engineer, @Walmartlabs, USA
I needed a fresh look at some of my slides. I've tried to find a way to create a paintbrush effect, to underline, accentuate, add some color and the handwritten markers were just the things. Very easy to use, easy to size, change the color. It was an affordable, perfect solution and I'm happy to recommend it.
Anonymous, US
The crisp, clean look of the graphics, and the fact that it allowed me to easily edit and change the colors to match the template was my main reason for purchasing them.
Brandie Jenkins, E-learning Developer, USA
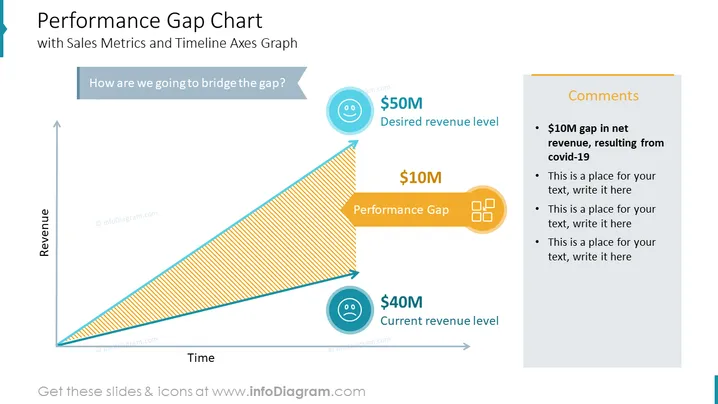
This is a Performance Gap Chart Slide from the Gap Analysis Template deck. It presents the Performance Gap between Revenue and Time. The difference between the Current Revenue Level and the Desired Revenue Level is called the performance gap. This Presentation Slide explains how you will Bridge the Gap. Write your Target Revenue and the gap between your current situation and your desired future state.
Timeline Axes Graph, Arrow Line Icon, Editable Slide, Smile Emoji Vector, Happiness Icon, Circle Flat Icon, Outline Icon, White Color Smiley Icon, Sad Emoji Icon, Sadness Icon Vector, Colorful Ribbon Banner Clipart, Performance Icon, Banner Button with Arrow Shape, Framework Slide Template


