Your graphics add a nice touch to my presentations and I recently used them for one of my all-hands meetings. Your toolbox adds professionalism to my slides. Instead of using standard clipart.
Claude Jones, Director of Engineer, @Walmartlabs, USA
Your graphics add a nice touch to my presentations and I recently used them for one of my all-hands meetings. Your toolbox adds professionalism to my slides. Instead of using standard clipart.
Claude Jones, Director of Engineer, @Walmartlabs, USA
I needed a fresh look at some of my slides. I've tried to find a way to create a paintbrush effect, to underline, accentuate, add some color and the handwritten markers were just the things. Very easy to use, easy to size, change the color. It was an affordable, perfect solution and I'm happy to recommend it.
Anonymous, US
The crisp, clean look of the graphics, and the fact that it allowed me to easily edit and change the colors to match the template was my main reason for purchasing them.
Brandie Jenkins, E-learning Developer, USA
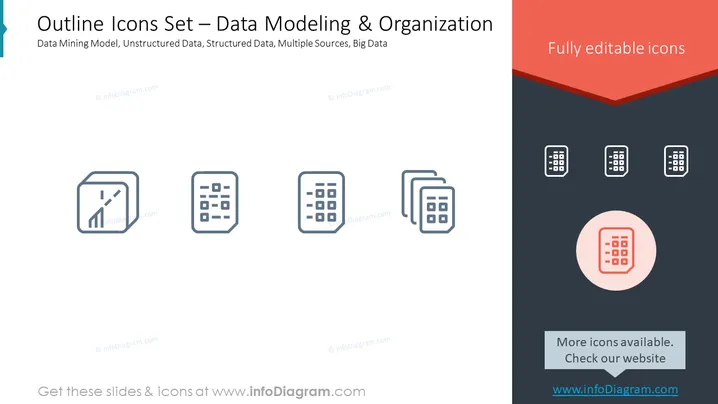
The slide presents an 'Outline Icons Set' related to 'Data Modeling & Organization', dealing with Data Mining Model—symbols representing the process of discovering patterns from large data sets; Unstructured Data—representation of information that doesn't reside in a traditional row-column database; Structured Data—icons denoting data that is organized and easily searchable; Multiple Sources—indicative of data being gathered from various origins; Big Data—denoting immense volumes of data that can be analyzed for insights.
The overall look of the slide is minimalist, with a focus on visual representation through icons. The use of contrasting colors and the emphasis on one icon gives visual cues to the viewer about the slide's elements.


