
Your graphics add a nice touch to my presentations and I recently used them for one of my all-hands meetings. Your toolbox adds professionalism to my slides. Instead of using standard clipart.
Claude Jones, Director of Engineer, @Walmartlabs, USA
Your graphics add a nice touch to my presentations and I recently used them for one of my all-hands meetings. Your toolbox adds professionalism to my slides. Instead of using standard clipart.
Claude Jones, Director of Engineer, @Walmartlabs, USA
I needed a fresh look at some of my slides. I've tried to find a way to create a paintbrush effect, to underline, accentuate, add some color and the handwritten markers were just the things. Very easy to use, easy to size, change the color. It was an affordable, perfect solution and I'm happy to recommend it.
Anonymous, US
The crisp, clean look of the graphics, and the fact that it allowed me to easily edit and change the colors to match the template was my main reason for purchasing them.
Brandie Jenkins, E-learning Developer, USA
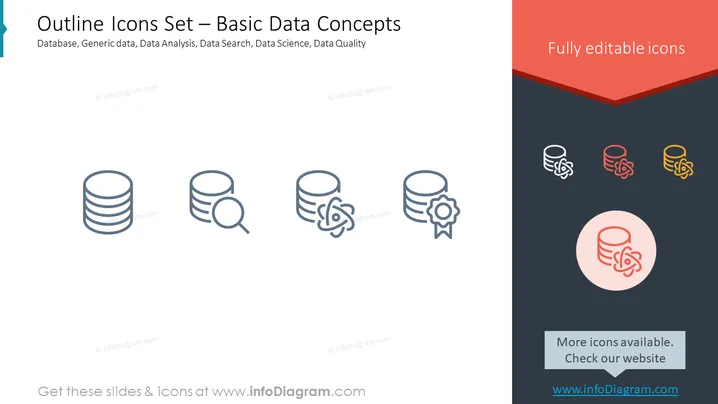
The PowerPoint slide presents a set of outline icons representing basic concepts related to data. Included is an icon for a "Database," which typically symbolizes data storage and management systems. "Generic data" suggests any form of data that can be processed. "Data Analysis" icon implies the examination of data sets to extract insights. "Data Search" indicates the process of finding specific information within a large data set. "Data Science" denotes a discipline that uses algorithms and systems to extract knowledge from data. Lastly, "Data Quality" signifies the accuracy and reliability of data.
The slide has a clean and modern look with a simple color scheme enhancing the visibility of the icons. The graphical composition is balanced, with icons being the central focus to convey the concepts effectively.




