Your graphics add a nice touch to my presentations and I recently used them for one of my all-hands meetings. Your toolbox adds professionalism to my slides. Instead of using standard clipart.
Claude Jones, Director of Engineer, @Walmartlabs, USA
Your graphics add a nice touch to my presentations and I recently used them for one of my all-hands meetings. Your toolbox adds professionalism to my slides. Instead of using standard clipart.
Claude Jones, Director of Engineer, @Walmartlabs, USA
I needed a fresh look at some of my slides. I've tried to find a way to create a paintbrush effect, to underline, accentuate, add some color and the handwritten markers were just the things. Very easy to use, easy to size, change the color. It was an affordable, perfect solution and I'm happy to recommend it.
Anonymous, US
The crisp, clean look of the graphics, and the fact that it allowed me to easily edit and change the colors to match the template was my main reason for purchasing them.
Brandie Jenkins, E-learning Developer, USA
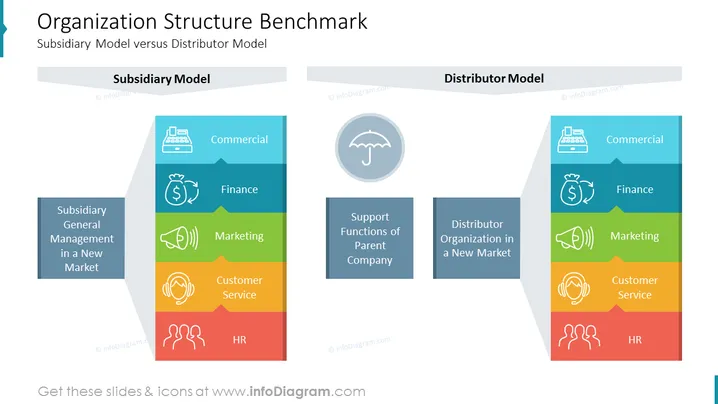
The slide compares two business models: the Subsidiary Model and the Distributor Model, explaining various functional areas within an organization. The Subsidiary Model includes "Subsidiary General Management in a New Market" and functional areas like Commercial, Finance, Marketing, Customer Service, and HR. "Support Functions of Parent Company" complement it. The Distributor Model includes "Distributor Organization in a New Market" with the same functional areas. Each functional area is paired with an icon that illustrates its role, providing a visual representation of the organizational structure within two distinct business approaches.
The slide presents a clean design with sharp segmented sections representing each model. The use of color gradients and meaningful icons makes it both visually appealing and informative.


