Reviews
Ihre Grafiken verleihen meinen Präsentationen eine nette Note, und ich habe sie kürzlich für eines meiner All-Hands-Meetings verwendet. Ihre Toolbox verleiht meinen Folien Professionalität, anstatt Standard-Clipart zu verwenden.
Ich brauchte einen neuen Blick auf einige meiner Folien. Ich habe versucht, einen Weg zu finden, einen Pinselschlag-Effekt zu erzielen, um zu unterstreichen, hervorzuheben, Farbe hinzuzufügen, und die handgeschriebenen Markierungen waren genau das Richtige. Sehr einfach zu bedienen, leicht in der Größe zu ändern, die Farbe zu ändern. Es war eine erschwingliche, perfekte Lösung und ich empfehle sie gerne weiter.
Die klare, saubere Optik der Grafiken und die Tatsache, dass ich die Farben leicht bearbeiten und an die Vorlage anpassen konnte, war mein Hauptgrund für den Kauf.
Description
NGO Programs Restricted Funds Allocation
Slide Content
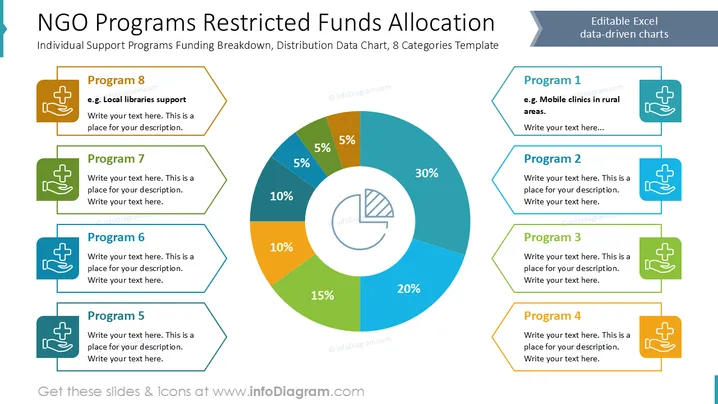
The slide outlines the allocation of funds for various NGO programs with a pie chart illustrating distribution percentages.
- Program 1: Focus on mobile clinics in rural areas for healthcare access.
- Program 2: A segment dedicated to a specific support area, detailed by the presenter.
- Program 3: Focused on delivering targeted aid, details specified by presenter.
- Program 4: An initiative expanded upon in the presenter's description.
- Program 5: Tailored for specific community support efforts, elaborated by presenter.
- Program 6: Another specified program offering unique services.
- Program 7: Details a line of support, specific to the audience.
- Program 8: Support for local libraries, increasing educational resources.
Graphical Look
- The slide features a central pie chart with vibrant colors indicating fund distribution: 30% blue, 20% turquoise, 15% green, 10% orange and dark teal, and 5% each in blue, dark green, and brown.
- Icons of medical cross and hand are used for each program block, symbolizing health and support.
- Each program is individually boxed, with colored borders matching pie chart segments, enhancing visual clarity.
- A right-aligned label notes “Editable Excel data-driven charts” in a banner.
- A balanced layout with symmetrical side columns listing programs around the central chart.
Overall, the slide is visually balanced and effectively communicates information through clear segmentation and vibrant colors. The use of icons adds immediacy to understanding each program’s focus.
Use Cases
- Presentation on NGO funding strategy: Use this slide to demonstrate fund allocation strategies during a board meeting.
- Investor briefing: Show investors how allocated funds are used in various programs.
- Community engagement: Explain to the community how funding supports local initiatives.
- Internal reviews - NGO workshops: Use in workshops to educate participants on program funding structures.
How to Edit
How to edit text & colors

How to expand / shorten diagram

How to Replace Icons in infoDiagram PPT
