Your graphics add a nice touch to my presentations and I recently used them for one of my all-hands meetings. Your toolbox adds professionalism to my slides. Instead of using standard clipart.
Claude Jones, Director of Engineer, @Walmartlabs, USA
Your graphics add a nice touch to my presentations and I recently used them for one of my all-hands meetings. Your toolbox adds professionalism to my slides. Instead of using standard clipart.
Claude Jones, Director of Engineer, @Walmartlabs, USA
I needed a fresh look at some of my slides. I've tried to find a way to create a paintbrush effect, to underline, accentuate, add some color and the handwritten markers were just the things. Very easy to use, easy to size, change the color. It was an affordable, perfect solution and I'm happy to recommend it.
Anonymous, US
The crisp, clean look of the graphics, and the fact that it allowed me to easily edit and change the colors to match the template was my main reason for purchasing them.
Brandie Jenkins, E-learning Developer, USA
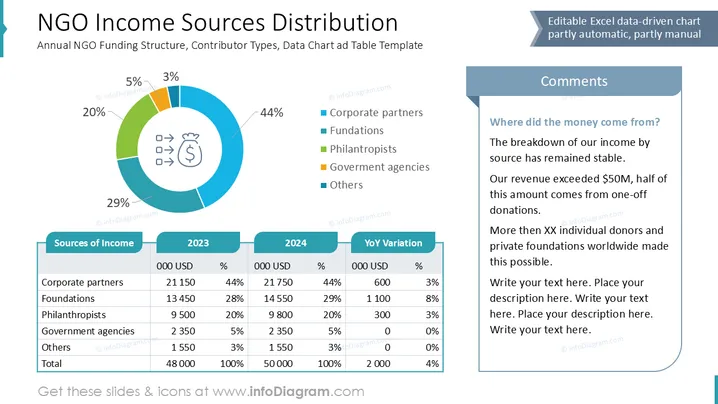
This slide elaborates on the income sources for an NGO. The primary sources include corporate partners contributing 44%, foundations providing 28%, and philanthropists donating 20%. Government agencies offer 5% of the total income, while 3% comes from other sources. The income has shown a year-over-year variation in contribution amounts and percentages. The slide includes comments on the stability and amount of NGO revenue, emphasizing recurring and one-time donations.
The slide effectively communicates the distribution of income sources with clear visuals and supporting text. Its cohesive design and use of color-coding enhance comprehension.


