Your graphics add a nice touch to my presentations and I recently used them for one of my all-hands meetings. Your toolbox adds professionalism to my slides. Instead of using standard clipart.
Claude Jones, Director of Engineer, @Walmartlabs, USA
Your graphics add a nice touch to my presentations and I recently used them for one of my all-hands meetings. Your toolbox adds professionalism to my slides. Instead of using standard clipart.
Claude Jones, Director of Engineer, @Walmartlabs, USA
I needed a fresh look at some of my slides. I've tried to find a way to create a paintbrush effect, to underline, accentuate, add some color and the handwritten markers were just the things. Very easy to use, easy to size, change the color. It was an affordable, perfect solution and I'm happy to recommend it.
Anonymous, US
The crisp, clean look of the graphics, and the fact that it allowed me to easily edit and change the colors to match the template was my main reason for purchasing them.
Brandie Jenkins, E-learning Developer, USA
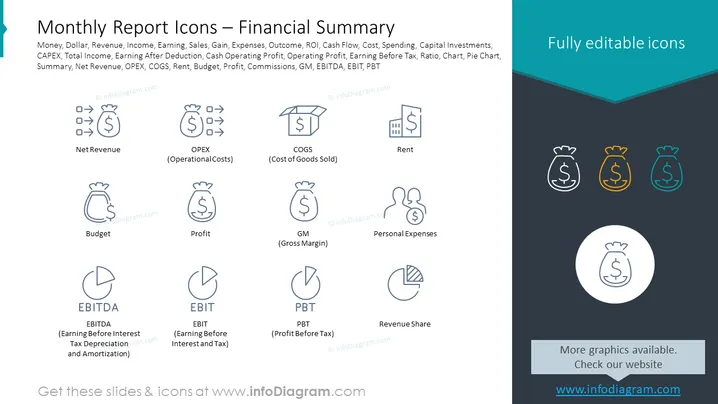
The slide presents a collection of financial icons representing various key financial metrics and terms such as Net Revenue, OPEX (Operational Costs), COGS (Cost of Goods Sold), Rent, Budget, Profit, GM (Gross Margin), Personal Expenses, EBITDA (Earning Before Interest Tax Depreciation and Amortization), EBIT (Earning Before Interest and Tax), and PBT (Profit Before Tax). Each icon is accompanied by a label briefly explaining the term, which can serve as a quick visual reference for these financial concepts in reports and presentations.
The overall look of the slide is very modern and business-like, focusing on clarity and easy comprehension. The use of color is restrained, with accents used to highlight the editable nature of the icons.


