

Your graphics add a nice touch to my presentations and I recently used them for one of my all-hands meetings. Your toolbox adds professionalism to my slides. Instead of using standard clipart.
Claude Jones, Director of Engineer, @Walmartlabs, USA

Your graphics add a nice touch to my presentations and I recently used them for one of my all-hands meetings. Your toolbox adds professionalism to my slides. Instead of using standard clipart.
Claude Jones, Director of Engineer, @Walmartlabs, USA
I needed a fresh look at some of my slides. I've tried to find a way to create a paintbrush effect, to underline, accentuate, add some color and the handwritten markers were just the things. Very easy to use, easy to size, change the color. It was an affordable, perfect solution and I'm happy to recommend it.
Anonymous, US
The crisp, clean look of the graphics, and the fact that it allowed me to easily edit and change the colors to match the template was my main reason for purchasing them.
Brandie Jenkins, E-learning Developer, USA
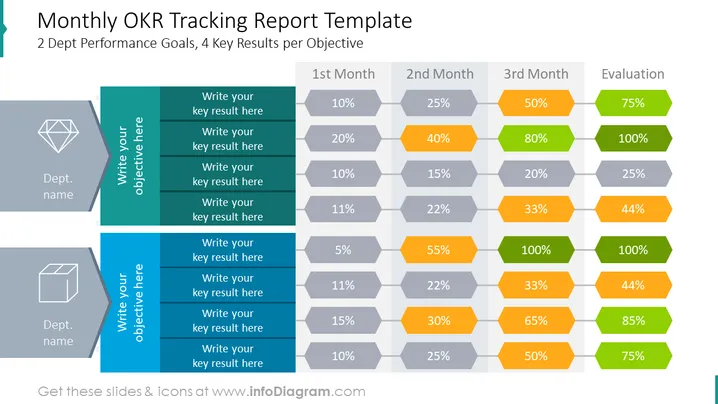
The slide displays a template for tracking Objectives and Key Results (OKRs) on a monthly basis for a department, which helps to clearly outline objectives, measure progress, and evaluate outcomes over a three-month period. There are placeholders for two department names on the left, each with four key results listed under the heading "Write your key result here." Alongside each key result are columns representing the progress for the first, second, and third months, followed by an evaluation column, with percentage values indicating the completion level of each key result, indicating how fully a goal has been attained.
The slide has a clean, professional look with a structured layout that uses geometric shapes to represent data. The color-coding provides a visual indication of progress and evaluation, enhancing the overall effectiveness of the presentation.



