Financial Decks
Visualize your results with ease
Monthly Gross Margin Evaluation
from deck
Monthly Business Report with Financial Performance Review (PowerPoint Template)
Info
Monthly Gross Margin Evaluation
Slide Content
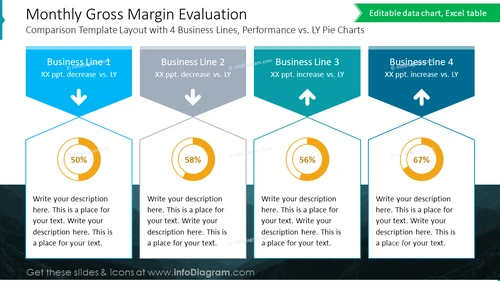
The PowerPoint slide titled "Monthly Gross Margin Evaluation" compares the performance of four business lines using pie charts, highlighting the changes in percentages compared to the previous year (LY). "Business Line 1" shows a decrease in performance, noted by a 50% marker and a downward arrow. "Business Line 2" also indicates a decrease, with a pie chart marking 58%. In contrast, both "Business Line 3" and "Business Line 4" exhibit increases, as denoted by upward arrows and pie chart percentages of 56% and 67%, respectively. Each business line section provides a placeholder to add a custom description.
Graphical Look
- The slide has a dark blue-green gradient background.
- There is a white, bold title at the top of the slide using a large font size.
- A smaller subtitle is present below the main title, printed in a light blue font color.
- The slide is divided into four main sections, each representing a business line, denoted by numbered headers in dark blue rectangles used to show a decrease or light blue to show an increase, overlaying a folded corner visual effect.
- Arrows (downward for Business Lines 1 and 2, upward for Business Lines 3 and 4) are used to indicate the direction of comparison versus last year in the rectangle headers.
- Circular pie chart graphics are centered in the layout of each business line section, with the percentage shown in the middle of the chart.
- Text boxes below each chart offer space to ‘Write your description here,’ with placeholder text suggesting where additional information can be added.
- The slide uses a mix of sans-serif fonts throughout.
The overall appearance is polished and professional, designed to clearly convey comparative data in a visual format. The color-coded rectangles and directional arrows immediately convey the change in gross margin performance for quick and easy interpretation.
Use Cases
- Presenting financial results to stakeholders to compare performance across different segments of a business.
- Used during a business strategy meeting to discuss which areas might require attention or changes in tactics.
- Ideal for quarterly business reviews to visually display trends and analyze performance over time.
- Could be used in investor presentations to provide a snapshot of financial health depicted through easily interpretable graphics.


