Your graphics add a nice touch to my presentations and I recently used them for one of my all-hands meetings. Your toolbox adds professionalism to my slides. Instead of using standard clipart.
Claude Jones, Director of Engineer, @Walmartlabs, USA
Your graphics add a nice touch to my presentations and I recently used them for one of my all-hands meetings. Your toolbox adds professionalism to my slides. Instead of using standard clipart.
Claude Jones, Director of Engineer, @Walmartlabs, USA
I needed a fresh look at some of my slides. I've tried to find a way to create a paintbrush effect, to underline, accentuate, add some color and the handwritten markers were just the things. Very easy to use, easy to size, change the color. It was an affordable, perfect solution and I'm happy to recommend it.
Anonymous, US
The crisp, clean look of the graphics, and the fact that it allowed me to easily edit and change the colors to match the template was my main reason for purchasing them.
Brandie Jenkins, E-learning Developer, USA
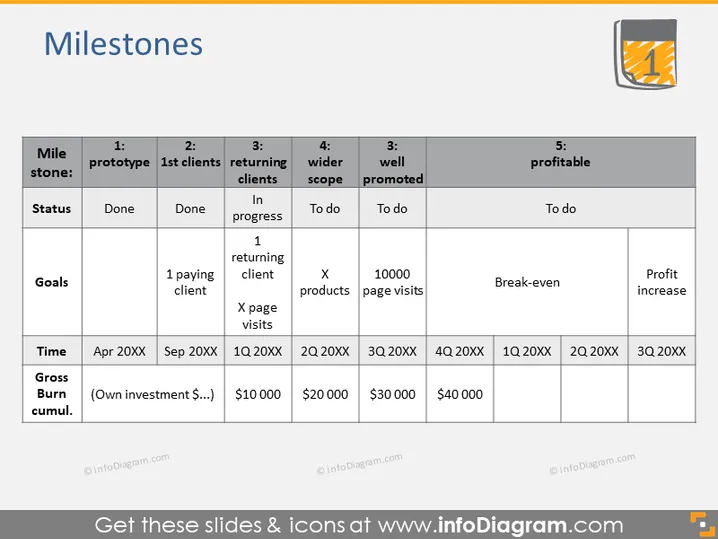
The PowerPoint slide titled "Milestones" details a five-stage development process for a project or a company. Each milestone includes the status of completion, specific goals, the time frame, and the cumulative gross burn. "1: prototype" and "2: 1st clients" milestones are marked as done, with goals of "1 paying client" and "Done," respectively. "3: returning clients" is in progress, aiming for one returning client and a certain number of page visits. "4: wider scope" and "5: profitable" are to-dos, with goals of expanding products and achieving a profit increase, along with targeted page visits and reaching break-even in milestone five.
The slide features a clean and professional design, using a restrained color palette mostly consisting of grays, blacks , and whites, with a touch of orange for the icon. The use of contrasting colors effectively highlights the completed milestones while maintaining a clear and organized display of information.


