Your graphics add a nice touch to my presentations and I recently used them for one of my all-hands meetings. Your toolbox adds professionalism to my slides. Instead of using standard clipart.
Claude Jones, Director of Engineer, @Walmartlabs, USA
Your graphics add a nice touch to my presentations and I recently used them for one of my all-hands meetings. Your toolbox adds professionalism to my slides. Instead of using standard clipart.
Claude Jones, Director of Engineer, @Walmartlabs, USA
I needed a fresh look at some of my slides. I've tried to find a way to create a paintbrush effect, to underline, accentuate, add some color and the handwritten markers were just the things. Very easy to use, easy to size, change the color. It was an affordable, perfect solution and I'm happy to recommend it.
Anonymous, US
The crisp, clean look of the graphics, and the fact that it allowed me to easily edit and change the colors to match the template was my main reason for purchasing them.
Brandie Jenkins, E-learning Developer, USA
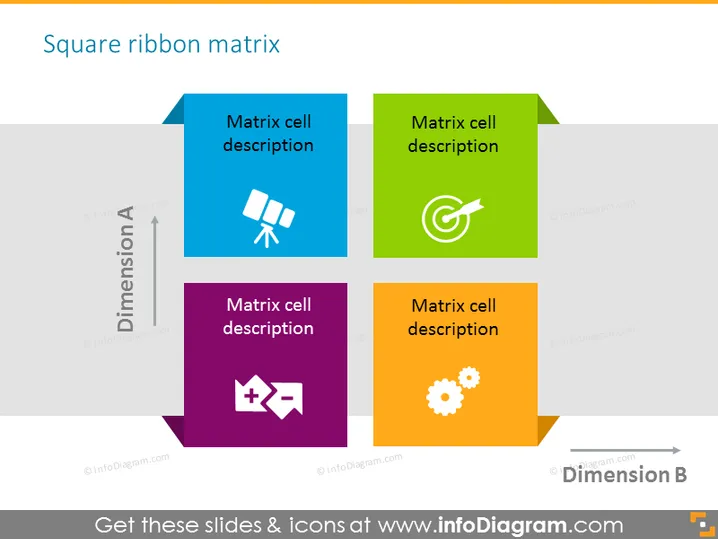
The slide presents a "Square ribbon matrix" consisting of four colored squares representing matrix cells, each containing an icon and placeholder text for a description. The cells are organized to create a 2x2 matrix indicating a relationship between two dimensions, labeled "Dimension A" and "Dimension B." Each matrix cell's color, icon, and description offer a unique aspect that needs to be detailed, explaining how different elements relate within the matrix.
The overall look of the slide is clean and modern, with a clear focus on the matrix structure. The use of bright colors and distinct icons helps differentiate the elements of the matrix.


