Your graphics add a nice touch to my presentations and I recently used them for one of my all-hands meetings. Your toolbox adds professionalism to my slides. Instead of using standard clipart.
Claude Jones, Director of Engineer, @Walmartlabs, USA
Your graphics add a nice touch to my presentations and I recently used them for one of my all-hands meetings. Your toolbox adds professionalism to my slides. Instead of using standard clipart.
Claude Jones, Director of Engineer, @Walmartlabs, USA
I needed a fresh look at some of my slides. I've tried to find a way to create a paintbrush effect, to underline, accentuate, add some color and the handwritten markers were just the things. Very easy to use, easy to size, change the color. It was an affordable, perfect solution and I'm happy to recommend it.
Anonymous, US
The crisp, clean look of the graphics, and the fact that it allowed me to easily edit and change the colors to match the template was my main reason for purchasing them.
Brandie Jenkins, E-learning Developer, USA
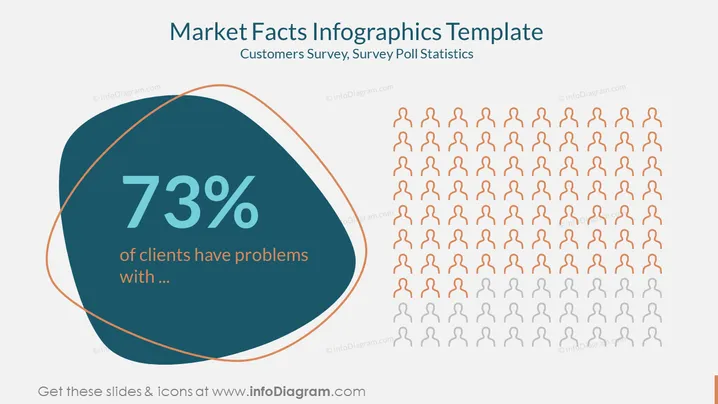
The slide depicts statistical data from a customer survey or poll, focusing on a specific result where "73% of clients have problems with..." This percentage suggests a significant portion of clients are facing an issue that is likely to be of concern to the audience. The ellipsis indicates that the exact nature of the issues faced by clients is not specified in this template and would need to be filled in for the specific context in which the slide is used. The large percentage figure is meant to draw attention to the magnitude of the client problems.
The slide has a modern and clean aesthetic, using contrast in color and size to draw attention to key information. The iconography enhances the statistical representation, making the data more relatable and intuitive.


