Your graphics add a nice touch to my presentations and I recently used them for one of my all-hands meetings. Your toolbox adds professionalism to my slides. Instead of using standard clipart.
Claude Jones, Director of Engineer, @Walmartlabs, USA
Your graphics add a nice touch to my presentations and I recently used them for one of my all-hands meetings. Your toolbox adds professionalism to my slides. Instead of using standard clipart.
Claude Jones, Director of Engineer, @Walmartlabs, USA
I needed a fresh look at some of my slides. I've tried to find a way to create a paintbrush effect, to underline, accentuate, add some color and the handwritten markers were just the things. Very easy to use, easy to size, change the color. It was an affordable, perfect solution and I'm happy to recommend it.
Anonymous, US
The crisp, clean look of the graphics, and the fact that it allowed me to easily edit and change the colors to match the template was my main reason for purchasing them.
Brandie Jenkins, E-learning Developer, USA
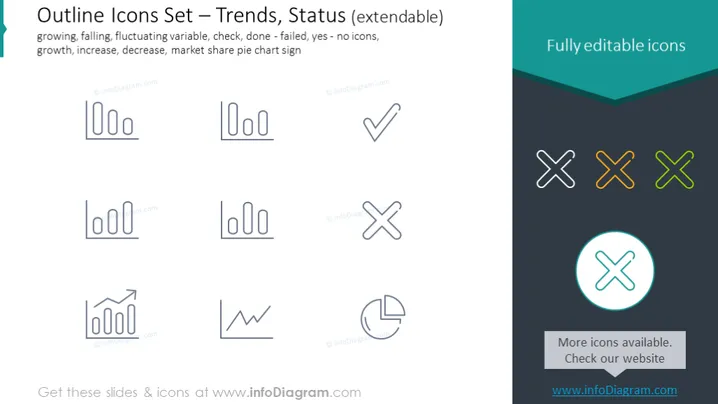
The slide presents a collection of outline icons related to trends and status indicators, which are extendable, meaning they can be customized or expanded upon. These icons represent various concepts such as growth, decline, fluctuation, completion, failure, consent, and market share. For instance, an upward trend bar graph indicates growth or increase, while a downward trend showcases decline or decrease. A checkmark might imply completion or success, and a cross could denote failure or rejection. The fluctuating line could represent variable trends or uncertainty, and the pie chart symbolizes market share or segmentation.
The slide has a clean, professional look with a focus on simplicity and clarity. The use of uniform outline icons with minimal color highlights results in an effective visual communication tool.


