Your graphics add a nice touch to my presentations and I recently used them for one of my all-hands meetings. Your toolbox adds professionalism to my slides. Instead of using standard clipart.
Claude Jones, Director of Engineer, @Walmartlabs, USA
Your graphics add a nice touch to my presentations and I recently used them for one of my all-hands meetings. Your toolbox adds professionalism to my slides. Instead of using standard clipart.
Claude Jones, Director of Engineer, @Walmartlabs, USA
I needed a fresh look at some of my slides. I've tried to find a way to create a paintbrush effect, to underline, accentuate, add some color and the handwritten markers were just the things. Very easy to use, easy to size, change the color. It was an affordable, perfect solution and I'm happy to recommend it.
Anonymous, US
The crisp, clean look of the graphics, and the fact that it allowed me to easily edit and change the colors to match the template was my main reason for purchasing them.
Brandie Jenkins, E-learning Developer, USA
All three Baltic countries are classified as high-income economies by the World Bank and maintain a very high Human Development Index. The three governments engage in intergovernmental and parliamentary cooperation. There is also frequent cooperation in foreign and security policy, defense, energy, and transportation. Wikipedia
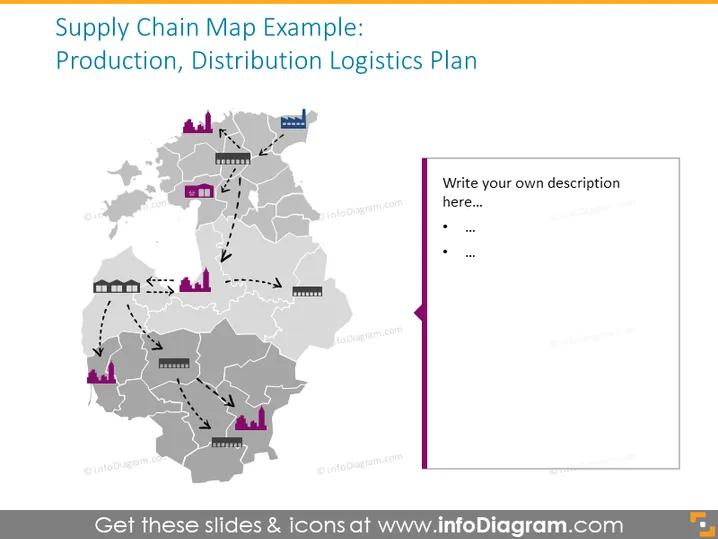
This PowerPoint template illustrates the Baltic region supply chain with production and a distribution plan. It’s a modern presentation template to save time supplemented with multiple icons and arrows to indicate the supply chain routes.
This Baltic Region Supply Chain Map slide is a part of our Baltic States Europe Maps with Administrative Territories PowerPoint Template.


