Your graphics add a nice touch to my presentations and I recently used them for one of my all-hands meetings. Your toolbox adds professionalism to my slides. Instead of using standard clipart.
Claude Jones, Director of Engineer, @Walmartlabs, USA
Your graphics add a nice touch to my presentations and I recently used them for one of my all-hands meetings. Your toolbox adds professionalism to my slides. Instead of using standard clipart.
Claude Jones, Director of Engineer, @Walmartlabs, USA
I needed a fresh look at some of my slides. I've tried to find a way to create a paintbrush effect, to underline, accentuate, add some color and the handwritten markers were just the things. Very easy to use, easy to size, change the color. It was an affordable, perfect solution and I'm happy to recommend it.
Anonymous, US
The crisp, clean look of the graphics, and the fact that it allowed me to easily edit and change the colors to match the template was my main reason for purchasing them.
Brandie Jenkins, E-learning Developer, USA
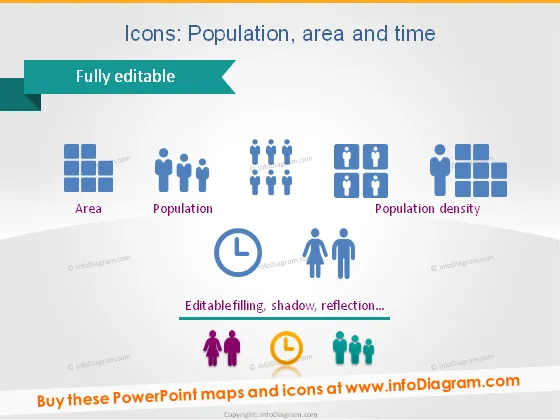
The slide is titled "Icons: Population, area and time" and showcases icons that are used to represent these three concepts visually. The icon for "Area" features a group of squared shapes closely packed together, symbolizing a confined space. The "Population" icon shows a cluster of human figures, indicating a group of people. The icon for "Population density" combines the elements of the previous two, using both the squared shapes and the human figures to represent the number of people within a given space. Lastly, there is a clock symbol with two human figures, which may represent demographic changes over time or scheduling related to population activities.
The slide has a modern and professional look, using a simple color palette and clear icons to convey its message. The icons are designed with a flat design aesthetic, and combined with shadows, give a sense of depth and easy legibility.


