Your graphics add a nice touch to my presentations and I recently used them for one of my all-hands meetings. Your toolbox adds professionalism to my slides. Instead of using standard clipart.
Claude Jones, Director of Engineer, @Walmartlabs, USA
Your graphics add a nice touch to my presentations and I recently used them for one of my all-hands meetings. Your toolbox adds professionalism to my slides. Instead of using standard clipart.
Claude Jones, Director of Engineer, @Walmartlabs, USA
I needed a fresh look at some of my slides. I've tried to find a way to create a paintbrush effect, to underline, accentuate, add some color and the handwritten markers were just the things. Very easy to use, easy to size, change the color. It was an affordable, perfect solution and I'm happy to recommend it.
Anonymous, US
The crisp, clean look of the graphics, and the fact that it allowed me to easily edit and change the colors to match the template was my main reason for purchasing them.
Brandie Jenkins, E-learning Developer, USA
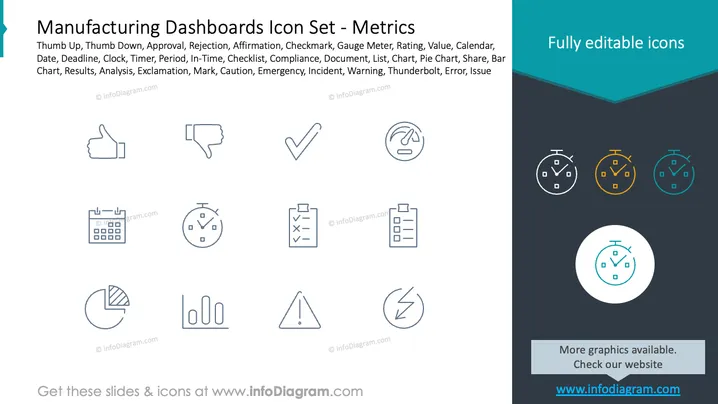
This PowerPoint slide is titled "Manufacturing Dashboards Icon Set - Metrics" and displays a collection of icons representing different metrics commonly used in manufacturing dashboards. These icons illustrate concepts such as Approval (likely indicating a positive status), Rejection (indicating a negative status), Compliance (suggesting adherence to standards or regulations), Deadline (signifying a time constraint), and Emergency (indicating urgent situations), among others. Each icon serves as a visual shorthand for the respective metric, designed to convey information quickly and clearly when utilized in dashboard interfaces.
The overall look of the slide is sleek and modern, with a professional color scheme. The use of iconography and bold color contrast ensures clarity and visual appeal, which are important for maintaining audience engagement in a presentation.


