Your graphics add a nice touch to my presentations and I recently used them for one of my all-hands meetings. Your toolbox adds professionalism to my slides. Instead of using standard clipart.
Claude Jones, Director of Engineer, @Walmartlabs, USA
Your graphics add a nice touch to my presentations and I recently used them for one of my all-hands meetings. Your toolbox adds professionalism to my slides. Instead of using standard clipart.
Claude Jones, Director of Engineer, @Walmartlabs, USA
I needed a fresh look at some of my slides. I've tried to find a way to create a paintbrush effect, to underline, accentuate, add some color and the handwritten markers were just the things. Very easy to use, easy to size, change the color. It was an affordable, perfect solution and I'm happy to recommend it.
Anonymous, US
The crisp, clean look of the graphics, and the fact that it allowed me to easily edit and change the colors to match the template was my main reason for purchasing them.
Brandie Jenkins, E-learning Developer, USA
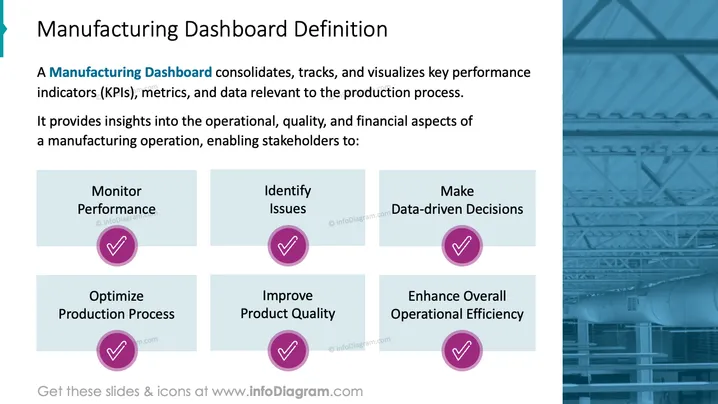
The slide titled "Manufacturing Dashboard Definition" elaborates on how a Manufacturing Dashboard consolidates, tracks, and visualizes key performance indicators (KPIs), metrics, and data relevant to the production process. It indicates that such a dashboard is beneficial for garnering insights into operational, quality, and financial aspects of a manufacturing operation. These insights empower stakeholders to undertake six core actions: Monitor Performance, Identify Issues, Make Data-driven Decisions, Optimize Production Process, Improve Product Quality, and Enhance Overall Operational Efficiency. Each of these actions is crucial for maintaining and improving the effectiveness of a manufacturing operation.
The slide is professionally styled with an industrial theme and clearly delineated sections for text and graphical icons, which aids in conveying the information in an organized manner.


