Your graphics add a nice touch to my presentations and I recently used them for one of my all-hands meetings. Your toolbox adds professionalism to my slides. Instead of using standard clipart.
Claude Jones, Director of Engineer, @Walmartlabs, USA
Your graphics add a nice touch to my presentations and I recently used them for one of my all-hands meetings. Your toolbox adds professionalism to my slides. Instead of using standard clipart.
Claude Jones, Director of Engineer, @Walmartlabs, USA
I needed a fresh look at some of my slides. I've tried to find a way to create a paintbrush effect, to underline, accentuate, add some color and the handwritten markers were just the things. Very easy to use, easy to size, change the color. It was an affordable, perfect solution and I'm happy to recommend it.
Anonymous, US
The crisp, clean look of the graphics, and the fact that it allowed me to easily edit and change the colors to match the template was my main reason for purchasing them.
Brandie Jenkins, E-learning Developer, USA
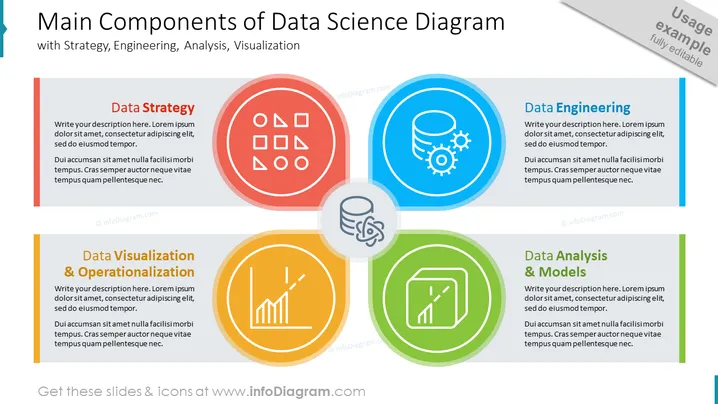
The PowerPoint slide presents four core aspects of data science: Data Strategy, Data Engineering, Data Analysis & Models, and Data Visualization & Operationalization. Data Strategy involves planning and governance, essential for aligning data-related activities with business objectives. Data Engineering focuses on the construction and maintenance of data pipelines for reliable data flow. Data Analysis & Models emphasize the extraction of insights and the construction of predictive models from data. Lastly, Data Visualization & Operationalization highlights the importance of presenting data findings in an understandable format and putting them into practice.
Overall, the slide has a clean and professional look with a clear structure that uses color coding to differentiate between the various components. The icons are simple yet effectively convey the essence of each data science aspect.


