Your graphics add a nice touch to my presentations and I recently used them for one of my all-hands meetings. Your toolbox adds professionalism to my slides. Instead of using standard clipart.
Claude Jones, Director of Engineer, @Walmartlabs, USA
Your graphics add a nice touch to my presentations and I recently used them for one of my all-hands meetings. Your toolbox adds professionalism to my slides. Instead of using standard clipart.
Claude Jones, Director of Engineer, @Walmartlabs, USA
I needed a fresh look at some of my slides. I've tried to find a way to create a paintbrush effect, to underline, accentuate, add some color and the handwritten markers were just the things. Very easy to use, easy to size, change the color. It was an affordable, perfect solution and I'm happy to recommend it.
Anonymous, US
The crisp, clean look of the graphics, and the fact that it allowed me to easily edit and change the colors to match the template was my main reason for purchasing them.
Brandie Jenkins, E-learning Developer, USA
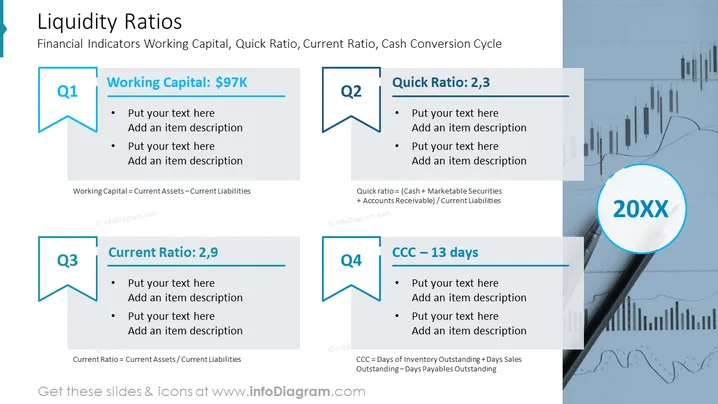
The PowerPoint slide is about financial indicators, specifically liquidity ratios. It is divided into 4 quadrants, each with a different ratio: Working Capital, Quick Ratio, Current Ratio, and Cash Conversion Cycle. The formula of the ratios are displayed under each quadrant. The higher the liquidity ratio, the more liquid the company is, meaning it has more assets that can be quickly converted to cash to meet its short-term obligations.
This slide can be used in a variety of business presentations, including:


