Your graphics add a nice touch to my presentations and I recently used them for one of my all-hands meetings. Your toolbox adds professionalism to my slides. Instead of using standard clipart.
Claude Jones, Director of Engineer, @Walmartlabs, USA
Your graphics add a nice touch to my presentations and I recently used them for one of my all-hands meetings. Your toolbox adds professionalism to my slides. Instead of using standard clipart.
Claude Jones, Director of Engineer, @Walmartlabs, USA
I needed a fresh look at some of my slides. I've tried to find a way to create a paintbrush effect, to underline, accentuate, add some color and the handwritten markers were just the things. Very easy to use, easy to size, change the color. It was an affordable, perfect solution and I'm happy to recommend it.
Anonymous, US
The crisp, clean look of the graphics, and the fact that it allowed me to easily edit and change the colors to match the template was my main reason for purchasing them.
Brandie Jenkins, E-learning Developer, USA
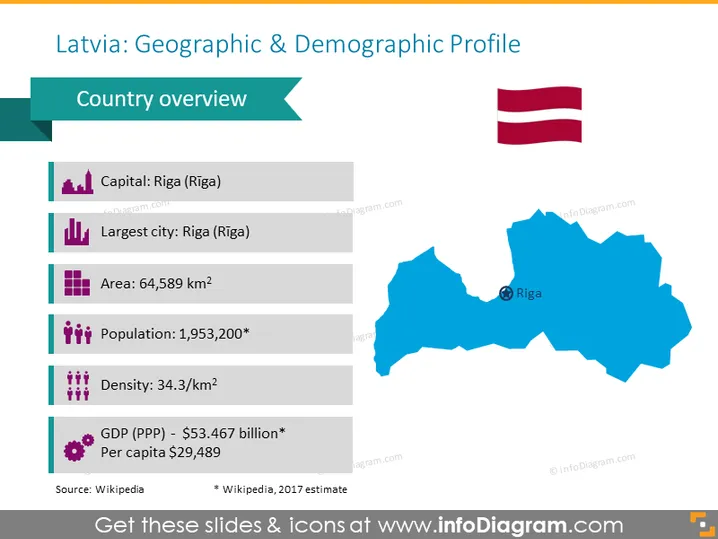
According to the provisional results of the Population and Housing Census 2011, the total population of Latvia on 1 March 2011 was 2,067,887. Since the previous census in 2000, the country's population decreased by 309,000 or 13%. Wikipedia
If you are presenting up-to-date demographic or geographic information about Latvia, use this template to visualize those details in an engaging way.
This Latvia Demographic & Geographic Map slide is a part of our Baltic States Europe Maps with Administrative Territories PowerPoint Template.


