Your graphics add a nice touch to my presentations and I recently used them for one of my all-hands meetings. Your toolbox adds professionalism to my slides. Instead of using standard clipart.
Claude Jones, Director of Engineer, @Walmartlabs, USA
Your graphics add a nice touch to my presentations and I recently used them for one of my all-hands meetings. Your toolbox adds professionalism to my slides. Instead of using standard clipart.
Claude Jones, Director of Engineer, @Walmartlabs, USA
I needed a fresh look at some of my slides. I've tried to find a way to create a paintbrush effect, to underline, accentuate, add some color and the handwritten markers were just the things. Very easy to use, easy to size, change the color. It was an affordable, perfect solution and I'm happy to recommend it.
Anonymous, US
The crisp, clean look of the graphics, and the fact that it allowed me to easily edit and change the colors to match the template was my main reason for purchasing them.
Brandie Jenkins, E-learning Developer, USA
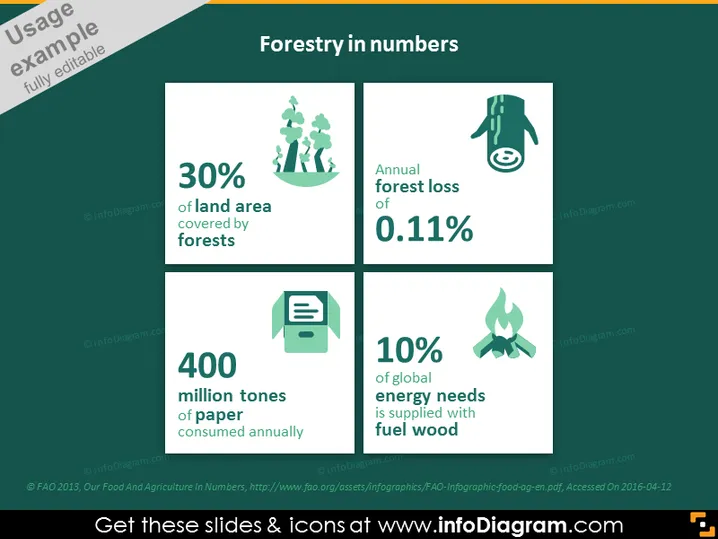
The slide presents key statistics around forestry with a focus on conservation and usage. It states that 30% of land area is covered by forests, indicating a measure of global forestry extent. It mentions an annual forest loss of 0.11%, highlighting concerns about deforestation rates. The statistic of 400 million tonnes of paper consumed annually suggests high paper use and potential environmental impact. Lastly, it points out that 10% of global energy needs are supplied with fuel wood, emphasizing the reliance on forests for energy.
The overall look of the slide is clean and modern, with a strong thematic color scheme that aligns with the topic of forestry. The use of icons and text makes for an easy-to-follow presentation of data.


