Your graphics add a nice touch to my presentations and I recently used them for one of my all-hands meetings. Your toolbox adds professionalism to my slides. Instead of using standard clipart.
Claude Jones, Director of Engineer, @Walmartlabs, USA
Your graphics add a nice touch to my presentations and I recently used them for one of my all-hands meetings. Your toolbox adds professionalism to my slides. Instead of using standard clipart.
Claude Jones, Director of Engineer, @Walmartlabs, USA
I needed a fresh look at some of my slides. I've tried to find a way to create a paintbrush effect, to underline, accentuate, add some color and the handwritten markers were just the things. Very easy to use, easy to size, change the color. It was an affordable, perfect solution and I'm happy to recommend it.
Anonymous, US
The crisp, clean look of the graphics, and the fact that it allowed me to easily edit and change the colors to match the template was my main reason for purchasing them.
Brandie Jenkins, E-learning Developer, USA
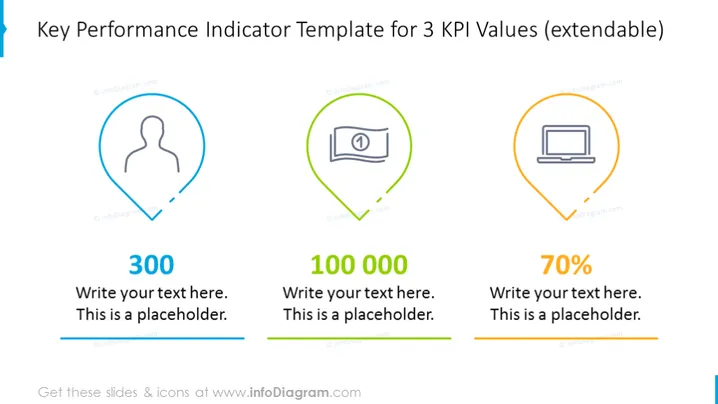
This slide presents a Key Performance Indicator (KPI) template for tracking and displaying three distinct performance measurements. Each KPI representation includes a unique icon signifying the KPI category, a large numerical value indicating the KPI result, and a placeholder text area for further descriptions or interpretations of the data. The template is versatile, allowing for adjustments and additions that accommodate more than three KPIs if needed, making it a dynamic tool for performance reporting.
The slide has a clean, modern look with a minimalist design that focuses on clarity and readability. The use of color and icons helps differentiate between the KPIs, while the organized layout ensures the information is easily digestible.


