KPI Outline Icons, Structure and Management
Slide Content
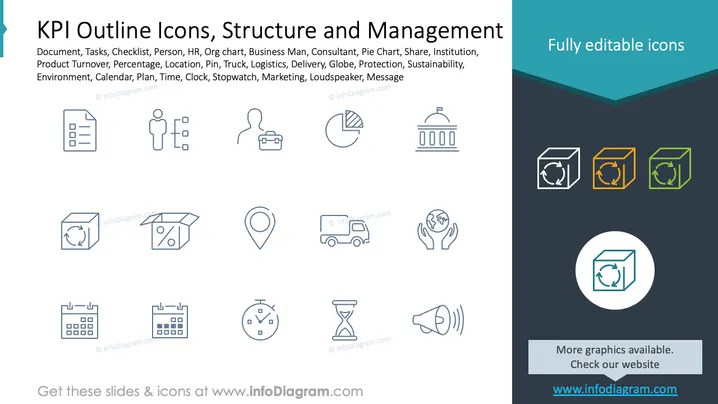
The slide presents a collection of Key Performance Indicator (KPI) outline icons related to structure and management. These include: Document, symbolizing reports or files; Tasks, indicating workload management; Checklist, denoting task completion; Person, representing individuals in an organization; HR, showcasing human resources; Org chart, illustrating organizational structure; Business Man, Consultant, Pie Chart, and Share, related to business analytics; Institution, Product Turnover, Percentage, Location, Pin, Truck, Logistics, Delivery, Globe, highlighting operations; Protection, Sustainability, Environment, suggesting CSR; Calendar, Plan, Time, Clock, Stopwatch, managing schedules; Marketing, Loudspeaker, and Message for communication.
Graphical Look
- The slide has a clean, structured layout with a white background.
- Icons are simple, line-drawing style, colored in soft blue, promoting a minimalist look.
- The left side displays varied icons in simplified forms aligned in rows.
- The right side has a dark blue panel featuring colorful cube icons in white, orange, and green.
- Text in the right panel highlights the "Fully editable icons" feature and a circular icon version.
- Overall, the design focuses on clarity and ease of understanding.
The slide's simple yet informative design makes it ideal for presentations, offering a clear view of icons relevant to business management and KPIs.
Use Cases
- Illustrating key performance indicators in a business meeting.
- Enhancing visual appeal in strategy planning presentations.
- Clarifying complex business processes using simple iconography.
- Streamlining project management discussions with universal symbols.