Your graphics add a nice touch to my presentations and I recently used them for one of my all-hands meetings. Your toolbox adds professionalism to my slides. Instead of using standard clipart.
Claude Jones, Director of Engineer, @Walmartlabs, USA
Your graphics add a nice touch to my presentations and I recently used them for one of my all-hands meetings. Your toolbox adds professionalism to my slides. Instead of using standard clipart.
Claude Jones, Director of Engineer, @Walmartlabs, USA
I needed a fresh look at some of my slides. I've tried to find a way to create a paintbrush effect, to underline, accentuate, add some color and the handwritten markers were just the things. Very easy to use, easy to size, change the color. It was an affordable, perfect solution and I'm happy to recommend it.
Anonymous, US
The crisp, clean look of the graphics, and the fact that it allowed me to easily edit and change the colors to match the template was my main reason for purchasing them.
Brandie Jenkins, E-learning Developer, USA
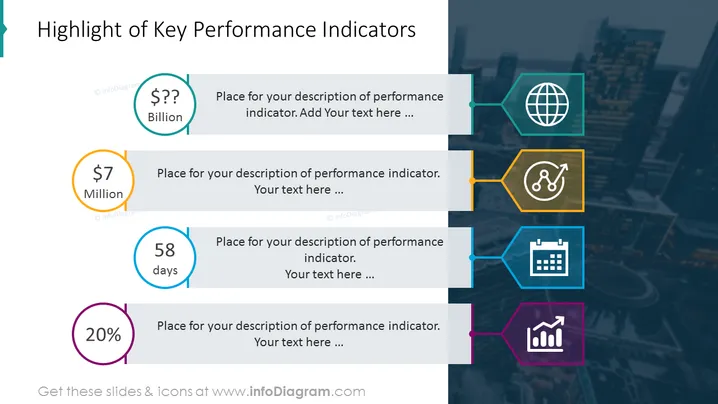
##Slide content:
This slide shows the KPI stock market highlights. Several associative icons can help you present your topic briefly and understandable. For example, $X billion cash flow global, 58 days to achieve something, 20% growth from stocks, etc. All the graphics are editable, so you can adjust them as you need. You can also download it in other software such as Google Slides and/or Keynote, without any quality loss. This PPT slide is part of the Stock Financial Annual Report PowerPoint Template. Click on the picture to see more slide ideas.
##Slide infographic description:
Text Banners, Flat Style Outline Icons, Circle Vectors, Global Icon, Calendar Icon, Growth Chart Icon, Office View Background


