Your graphics add a nice touch to my presentations and I recently used them for one of my all-hands meetings. Your toolbox adds professionalism to my slides. Instead of using standard clipart.
Claude Jones, Director of Engineer, @Walmartlabs, USA
Your graphics add a nice touch to my presentations and I recently used them for one of my all-hands meetings. Your toolbox adds professionalism to my slides. Instead of using standard clipart.
Claude Jones, Director of Engineer, @Walmartlabs, USA
I needed a fresh look at some of my slides. I've tried to find a way to create a paintbrush effect, to underline, accentuate, add some color and the handwritten markers were just the things. Very easy to use, easy to size, change the color. It was an affordable, perfect solution and I'm happy to recommend it.
Anonymous, US
The crisp, clean look of the graphics, and the fact that it allowed me to easily edit and change the colors to match the template was my main reason for purchasing them.
Brandie Jenkins, E-learning Developer, USA
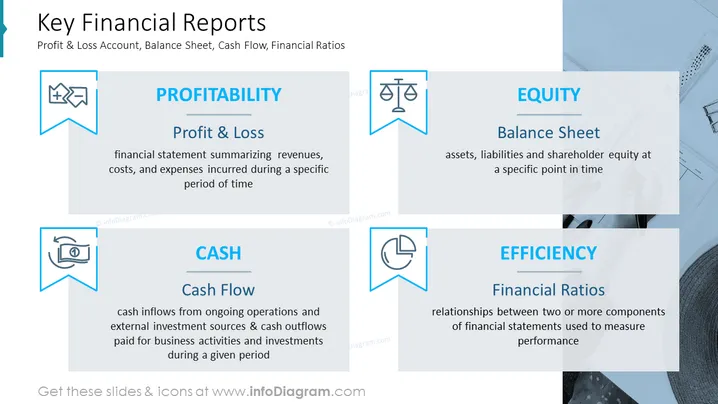
The PowerPoint slide is about the four key financial reports: Profit & Loss Account, Balance Sheet, Cash Flow, and Efficiency Ratios. The Profit & Loss Account is a financial statement summarizing revenues, costs, and expenses incurred during a specific period of time. The Balance Sheet is a snapshot of a company’s financial position at a specific point in time, showing assets, liabilities, and shareholder equity. The Cash Flow statement shows cash inflows from ongoing operations and external investment sources and cash outflows paid for business activities and investments. Efficiency Ratios are financial ratios that measure a company’s operational performance.
You can use such a slide in a variety of settings, such as:


