Your graphics add a nice touch to my presentations and I recently used them for one of my all-hands meetings. Your toolbox adds professionalism to my slides. Instead of using standard clipart.
Claude Jones, Director of Engineer, @Walmartlabs, USA
Your graphics add a nice touch to my presentations and I recently used them for one of my all-hands meetings. Your toolbox adds professionalism to my slides. Instead of using standard clipart.
Claude Jones, Director of Engineer, @Walmartlabs, USA
I needed a fresh look at some of my slides. I've tried to find a way to create a paintbrush effect, to underline, accentuate, add some color and the handwritten markers were just the things. Very easy to use, easy to size, change the color. It was an affordable, perfect solution and I'm happy to recommend it.
Anonymous, US
The crisp, clean look of the graphics, and the fact that it allowed me to easily edit and change the colors to match the template was my main reason for purchasing them.
Brandie Jenkins, E-learning Developer, USA
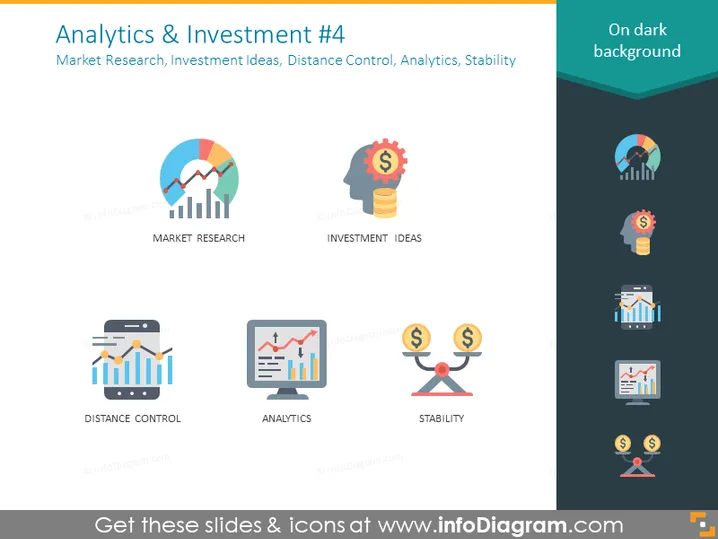
The slide is titled "Analytics & Investment #4" and covers the concepts of Market Research, Investment Ideas, Distance Control, Analytics, and Stability. Market Research is typically associated with the process of gathering, analyzing, and interpreting information about a market, and on the slide, it is symbolized with a pie chart merging into a bar graph. Investment Ideas likely refer to the strategies or plans for allocating resources in investment, represented by a lightbulb with a dollar sign. Distance Control may involve monitoring and managing operations remotely, indicated by a mobile device with bars of signal strength. Analytics involves the systematic analysis of data or statistics, depicted with a computer screen displaying a graph. Stability likely signifies financial stability, symbolized by a balance scale with dollar signs.
The overall look of the slide is modern and clean, with a professional color scheme that emphasizes the business and finance theme. The use of icons provides a quick visual reference for the concepts being presented.


