Your graphics add a nice touch to my presentations and I recently used them for one of my all-hands meetings. Your toolbox adds professionalism to my slides. Instead of using standard clipart.
Claude Jones, Director of Engineer, @Walmartlabs, USA
Your graphics add a nice touch to my presentations and I recently used them for one of my all-hands meetings. Your toolbox adds professionalism to my slides. Instead of using standard clipart.
Claude Jones, Director of Engineer, @Walmartlabs, USA
I needed a fresh look at some of my slides. I've tried to find a way to create a paintbrush effect, to underline, accentuate, add some color and the handwritten markers were just the things. Very easy to use, easy to size, change the color. It was an affordable, perfect solution and I'm happy to recommend it.
Anonymous, US
The crisp, clean look of the graphics, and the fact that it allowed me to easily edit and change the colors to match the template was my main reason for purchasing them.
Brandie Jenkins, E-learning Developer, USA
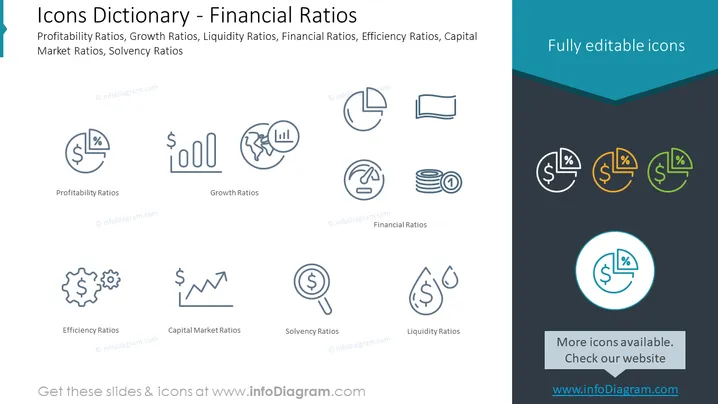
The slide is titled "Icons Dictionary - Financial Ratios" and presents a visual representation of various financial metrics. "Profitability Ratios" are depicted by a circular icon with a percentage symbol, indicating measures of a company's ability to generate profit relative to revenue, assets, or equity. "Growth Ratios" feature a graph and a globe, representing the company's revenue or profit increase over time. "Financial Ratios" icon implies general fiscal health assessment tools. "Efficiency Ratios" showcase gears, symbolizing operational performance. "Capital Market Ratios" display a magnifying glass over a line graph, highlighting valuation metrics. "Solvency Ratios" use a circle and a shield to express a company's capacity to meet long-term obligations. "Liquidity Ratios" are shown with a droplet and a coin, reflecting the ability to cover short-term liabilities.
The slide has a modern and clean look with simple, stylized icons that visually categorize and distinguish between different types of financial ratios. The selective color scheme presents a cohesive and polished visual experience.


