Your graphics add a nice touch to my presentations and I recently used them for one of my all-hands meetings. Your toolbox adds professionalism to my slides. Instead of using standard clipart.
Claude Jones, Director of Engineer, @Walmartlabs, USA
Your graphics add a nice touch to my presentations and I recently used them for one of my all-hands meetings. Your toolbox adds professionalism to my slides. Instead of using standard clipart.
Claude Jones, Director of Engineer, @Walmartlabs, USA
I needed a fresh look at some of my slides. I've tried to find a way to create a paintbrush effect, to underline, accentuate, add some color and the handwritten markers were just the things. Very easy to use, easy to size, change the color. It was an affordable, perfect solution and I'm happy to recommend it.
Anonymous, US
The crisp, clean look of the graphics, and the fact that it allowed me to easily edit and change the colors to match the template was my main reason for purchasing them.
Brandie Jenkins, E-learning Developer, USA
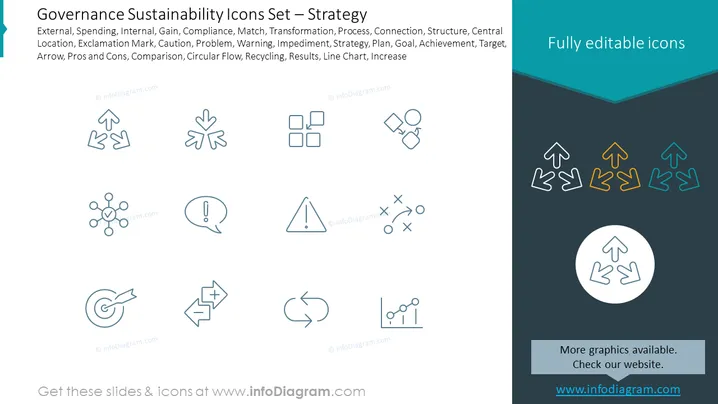
Slide Content: The slide presents a collection of icons related to governance and sustainability strategy. Each icon represents a different strategic concept: External (engagement with external factors), Spending (allocation of financial resources), Internal (focus on internal operations), Gain (achievement of benefits), Compliance (adherence to laws and standards), Match (alignment of resources or goals), Transformation (significant change or evolution), Process (sequence of actions or steps), Connection (link between elements), Structure (centralization or decentralization), Central Location (importance of a central organizing point), Exclamation Mark (attention or urgency), Caution (awareness of potential risks), Problem (identification of an issue), Warning (alert to danger or necessary caution), Impediment (obstacle to progress), Strategy (planning for desired outcomes), Plan (detailed proposal for action), Goal (desired result or achievement), Achievement (success in reaching a goal), Target (object of efforts or ambitions), Arrow (direction or progress), Pros and Cons (evaluation of advantages and disadvantages), Comparison (assessment of similarities and differences), Circular Flow (cycle or process that repeats), Recycling (reuse or conversion of waste), Results (outcome or consequences), Line Chart (representation of data trends), Increase (upward movement or growth). Each concept is crucial for developing strategies in governance and sustainability.
Graphical Look:
The overall look of the slide is sleek and professional, with a balanced layout that merges text with visual elements efficiently. The color scheme is harmonious and modern, making the information clear and visually appealing.
Use Cases:


