Your graphics add a nice touch to my presentations and I recently used them for one of my all-hands meetings. Your toolbox adds professionalism to my slides. Instead of using standard clipart.
Claude Jones, Director of Engineer, @Walmartlabs, USA
Your graphics add a nice touch to my presentations and I recently used them for one of my all-hands meetings. Your toolbox adds professionalism to my slides. Instead of using standard clipart.
Claude Jones, Director of Engineer, @Walmartlabs, USA
I needed a fresh look at some of my slides. I've tried to find a way to create a paintbrush effect, to underline, accentuate, add some color and the handwritten markers were just the things. Very easy to use, easy to size, change the color. It was an affordable, perfect solution and I'm happy to recommend it.
Anonymous, US
The crisp, clean look of the graphics, and the fact that it allowed me to easily edit and change the colors to match the template was my main reason for purchasing them.
Brandie Jenkins, E-learning Developer, USA
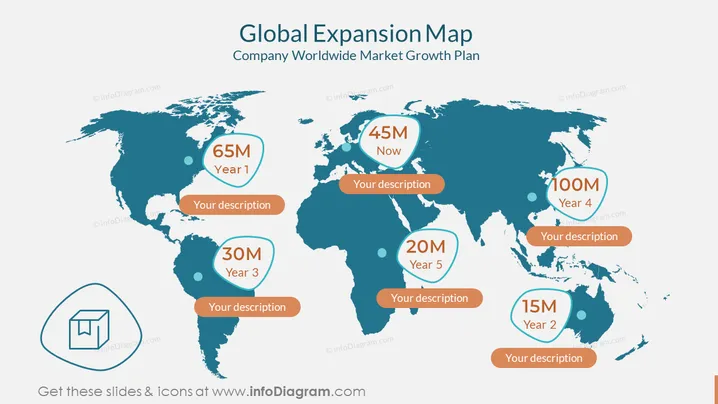
The PowerPoint slide depicts a global expansion strategy, associated with projected performance in Years 1 through 5 and the current status labeled as "Now." Numbers indicating performance metrics (65M, 45M, 100M, 30M, 20M, and 15M) are overlaying a world map, correlated with specific geographic regions. Each metric is accompanied by a bubble for additional description. This suggests a plan spreading over multiple continents, with the aim to grow the company's market reach and influence globally. Year 1 starts with 65M, indicating a metric such as revenue or users; "Now" is at 45M possibly showing the starting point; 100M at Year 4 shows significant growth; by Year 5, a new region starts contributing with 20M.
The overall look of the slide is professional and modern, with a clear emphasis on distribution and timeframe through its use of color and layout. The iconography and placement of figures suggest an organized approach to presenting complex geographic and temporal data.


