Your graphics add a nice touch to my presentations and I recently used them for one of my all-hands meetings. Your toolbox adds professionalism to my slides. Instead of using standard clipart.
Claude Jones, Director of Engineer, @Walmartlabs, USA
Your graphics add a nice touch to my presentations and I recently used them for one of my all-hands meetings. Your toolbox adds professionalism to my slides. Instead of using standard clipart.
Claude Jones, Director of Engineer, @Walmartlabs, USA
I needed a fresh look at some of my slides. I've tried to find a way to create a paintbrush effect, to underline, accentuate, add some color and the handwritten markers were just the things. Very easy to use, easy to size, change the color. It was an affordable, perfect solution and I'm happy to recommend it.
Anonymous, US
The crisp, clean look of the graphics, and the fact that it allowed me to easily edit and change the colors to match the template was my main reason for purchasing them.
Brandie Jenkins, E-learning Developer, USA
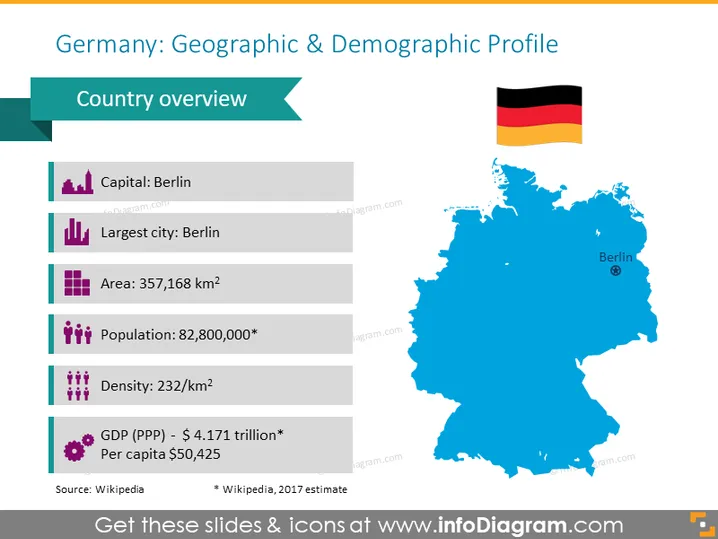
The demography of Germany is monitored by the Statistisches Bundesamt (Federal Statistical Office of Germany). According to the most recent data, Germany's population is 84,079,811 (30 June 2022) making it the most populous country in the European Union and the nineteenth-most populous country in the world. Wikipedia
If you are looking for a visual way to present demographic or geographic information about Germany, this template will serve you well. It has a map of Germany to highlight the regions you want, and 6 rows to give an overview of the country.
This Germany Geographic & Demographic Profile Map slide is a part of our Western Europe Map with Administrative Territories (Germany, France PPT editable Maps).


