Your graphics add a nice touch to my presentations and I recently used them for one of my all-hands meetings. Your toolbox adds professionalism to my slides. Instead of using standard clipart.
Claude Jones, Director of Engineer, @Walmartlabs, USA
Your graphics add a nice touch to my presentations and I recently used them for one of my all-hands meetings. Your toolbox adds professionalism to my slides. Instead of using standard clipart.
Claude Jones, Director of Engineer, @Walmartlabs, USA
I needed a fresh look at some of my slides. I've tried to find a way to create a paintbrush effect, to underline, accentuate, add some color and the handwritten markers were just the things. Very easy to use, easy to size, change the color. It was an affordable, perfect solution and I'm happy to recommend it.
Anonymous, US
The crisp, clean look of the graphics, and the fact that it allowed me to easily edit and change the colors to match the template was my main reason for purchasing them.
Brandie Jenkins, E-learning Developer, USA
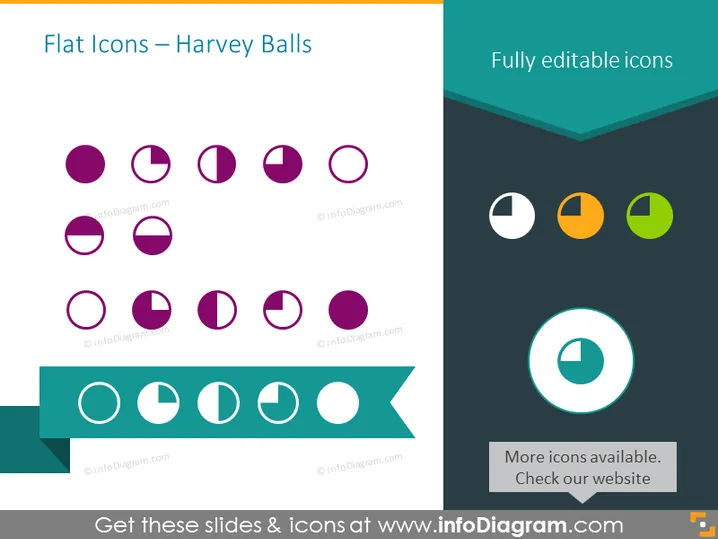
The slide illustrates how Harvey Balls can be used as flat icons to represent different levels of completion or satisfaction. These graphical indicators are commonly used for visualizing qualitative information. Each Harvey Ball on the slide represents a varying degree of a circle's completion, from full to empty. This provides a straightforward visual method to compare different items or categories based on the degree to which each has met a certain criterion. For example, a full circle might indicate 100% completion, whereas a half-filled circle could represent a 50% completion rate.
The slide has a modern and clean look with a strong use of geometry and color contrast. The left side of the slide features more traditional shades of purple while the right displays a more vibrant palette, enhancing visual interest.


