Your graphics add a nice touch to my presentations and I recently used them for one of my all-hands meetings. Your toolbox adds professionalism to my slides. Instead of using standard clipart.
Claude Jones, Director of Engineer, @Walmartlabs, USA
Your graphics add a nice touch to my presentations and I recently used them for one of my all-hands meetings. Your toolbox adds professionalism to my slides. Instead of using standard clipart.
Claude Jones, Director of Engineer, @Walmartlabs, USA
I needed a fresh look at some of my slides. I've tried to find a way to create a paintbrush effect, to underline, accentuate, add some color and the handwritten markers were just the things. Very easy to use, easy to size, change the color. It was an affordable, perfect solution and I'm happy to recommend it.
Anonymous, US
The crisp, clean look of the graphics, and the fact that it allowed me to easily edit and change the colors to match the template was my main reason for purchasing them.
Brandie Jenkins, E-learning Developer, USA
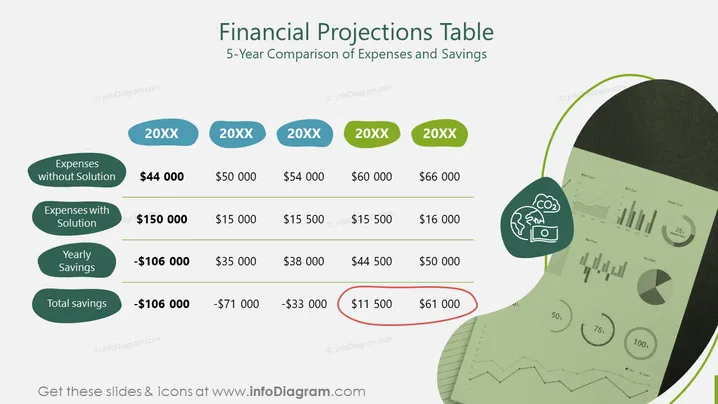
This slide presents a 5-year comparison of expenses and savings in a financial projections table format. It indicates the yearly costs incurred without a particular solution versus the expenses with the solution, showing both the annual savings and total savings over five years. For instance, in the first year, expenses without the solution are $44,000, but with the solution, they rise to $150,000, resulting in a yearly saving of -$106,000 which signifies a loss due to higher initial costs.
The slide features a clean, organized layout with a light background, contrasting with the colorful graphical elements. The use of green and blue tones suggests a financial or environmental theme.


