Your graphics add a nice touch to my presentations and I recently used them for one of my all-hands meetings. Your toolbox adds professionalism to my slides. Instead of using standard clipart.
Claude Jones, Director of Engineer, @Walmartlabs, USA
Your graphics add a nice touch to my presentations and I recently used them for one of my all-hands meetings. Your toolbox adds professionalism to my slides. Instead of using standard clipart.
Claude Jones, Director of Engineer, @Walmartlabs, USA
I needed a fresh look at some of my slides. I've tried to find a way to create a paintbrush effect, to underline, accentuate, add some color and the handwritten markers were just the things. Very easy to use, easy to size, change the color. It was an affordable, perfect solution and I'm happy to recommend it.
Anonymous, US
The crisp, clean look of the graphics, and the fact that it allowed me to easily edit and change the colors to match the template was my main reason for purchasing them.
Brandie Jenkins, E-learning Developer, USA
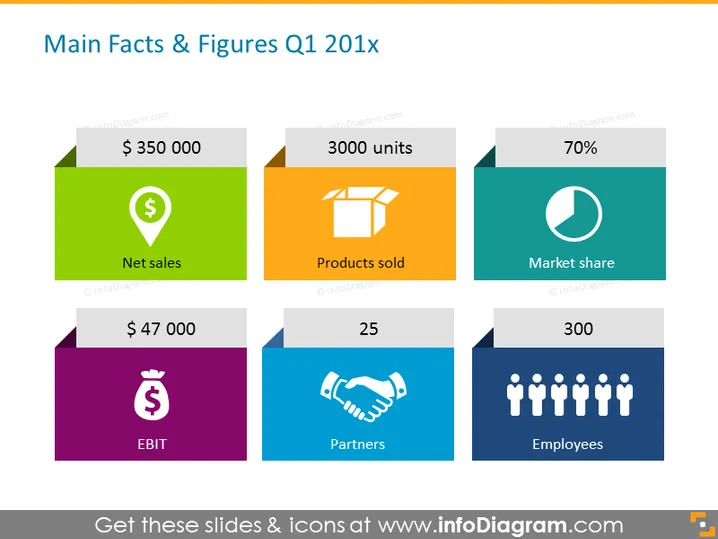
Facts and figures PowerPoint template to highlight the most important achievements during one quarter. Write down your net sales, products sold, market share, EBIT, partnerships, and the number of employees. Replace the standard grid tables which look very boring and unengaging, with interesting infographics and representative icons to make your presentation more clean looking, and help your audience understand the topic and the presentation flow smoothly. You can either just update the figures with the factual ones or do minor changes by editing the shapes. The presentation can be downloaded in other software, such as Google Slides and Keynote while keeping the quality of the elements. Click on the picture to see more retail business update slide illustrations.
Colorful Boxes, Net Sales Icon, 3D Box Icon, Pie Chart, Money Bag Icon, Handshake Icon, Staff Icon


