

Your graphics add a nice touch to my presentations and I recently used them for one of my all-hands meetings. Your toolbox adds professionalism to my slides. Instead of using standard clipart.
Claude Jones, Director of Engineer, @Walmartlabs, USA

Your graphics add a nice touch to my presentations and I recently used them for one of my all-hands meetings. Your toolbox adds professionalism to my slides. Instead of using standard clipart.
Claude Jones, Director of Engineer, @Walmartlabs, USA
I needed a fresh look at some of my slides. I've tried to find a way to create a paintbrush effect, to underline, accentuate, add some color and the handwritten markers were just the things. Very easy to use, easy to size, change the color. It was an affordable, perfect solution and I'm happy to recommend it.
Anonymous, US
The crisp, clean look of the graphics, and the fact that it allowed me to easily edit and change the colors to match the template was my main reason for purchasing them.
Brandie Jenkins, E-learning Developer, USA
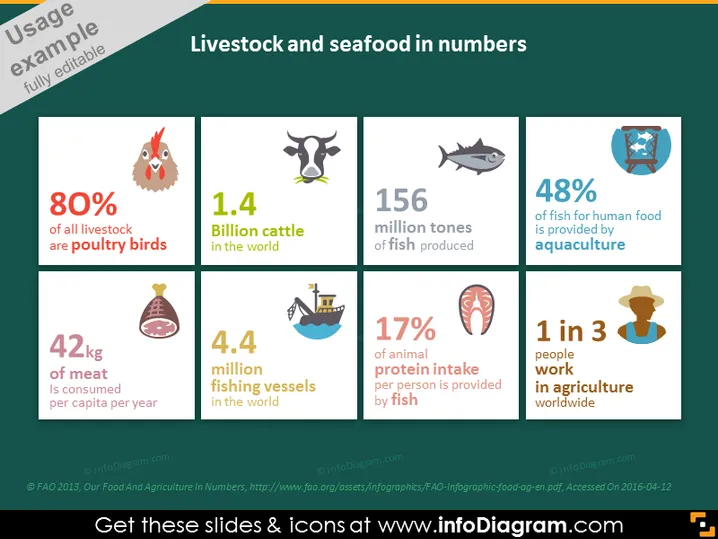
The slide presents statistical data related to livestock and seafood, with a focus on their prevalence and role in human nutrition and industry. 80% of all livestock are poultry birds, illustrating the dominance of poultry in livestock demographics. 42 kg of meat is consumed per capita each year, depicting meat consumption rates. 1.4 Billion cattle in the world and 4.4 million fishing vessels in the world are indicators of the scale of cattle population and the fishing industry, respectively. 156 million tonnes of fish produced indicates the volume of fish production. 48% of fish for human food is provided by aquaculture, highlighting the significance of controlled breeding, rearing, and harvesting of fish. 17% of animal protein intake per person is provided by fish, showing fish's contribution to human protein consumption. Lastly, 1 in 3 people work in agriculture worldwide, which demonstrates the employment significance of the agriculture sector globally.
The overall look is clean and professional, with strong visual hierarchy emphasizing key figures. The use of color, icons, and typography enhances readability and helps to quickly convey the slide's data points.
Presenting in ### Use Cases
Presenting in a business meeting about the agriculture or food production industry, to discuss market proportions and growth opportunities.
Used in educational settings to illustrate statistics in global livestock and seafood production for students.
Providing insights in a conference dedicated to addressing sustainability and environmental impact of the food industry.
Incorporating into investment presentations where the stakeholders might be interested in agriculture or fisheries market data.



