
Your graphics add a nice touch to my presentations and I recently used them for one of my all-hands meetings. Your toolbox adds professionalism to my slides. Instead of using standard clipart.
Claude Jones, Director of Engineer, @Walmartlabs, USA
Your graphics add a nice touch to my presentations and I recently used them for one of my all-hands meetings. Your toolbox adds professionalism to my slides. Instead of using standard clipart.
Claude Jones, Director of Engineer, @Walmartlabs, USA
I needed a fresh look at some of my slides. I've tried to find a way to create a paintbrush effect, to underline, accentuate, add some color and the handwritten markers were just the things. Very easy to use, easy to size, change the color. It was an affordable, perfect solution and I'm happy to recommend it.
Anonymous, US
The crisp, clean look of the graphics, and the fact that it allowed me to easily edit and change the colors to match the template was my main reason for purchasing them.
Brandie Jenkins, E-learning Developer, USA
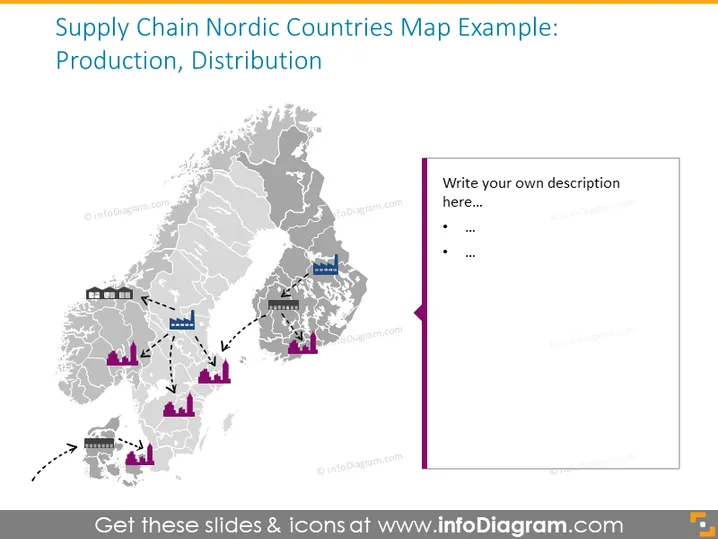
This PowerPoint slide displays a map representing supply chain logistics in the Nordic countries, focusing on production and distribution. Illustrated through a combination of icons and arrows, the graphic suggests movement of goods between factories represented by gear icons, warehouses or storage facilities denoted by box icons, and a retail outlet shown by a shopping bag icon. This infographic could be used for describing the flow of raw materials to production sites, the storage of finished goods, and their subsequent distribution to retail locations.
The slide has a clean and professional design with a predominantly grayscale palette accented by purple and blue elements that visually differentiate between various types of infrastructure. Arrows guide the viewer’s eye through the supposed supply chain flow, facilitating an understanding of the logistics involved.




