
Your graphics add a nice touch to my presentations and I recently used them for one of my all-hands meetings. Your toolbox adds professionalism to my slides. Instead of using standard clipart.
Claude Jones, Director of Engineer, @Walmartlabs, USA
Your graphics add a nice touch to my presentations and I recently used them for one of my all-hands meetings. Your toolbox adds professionalism to my slides. Instead of using standard clipart.
Claude Jones, Director of Engineer, @Walmartlabs, USA
I needed a fresh look at some of my slides. I've tried to find a way to create a paintbrush effect, to underline, accentuate, add some color and the handwritten markers were just the things. Very easy to use, easy to size, change the color. It was an affordable, perfect solution and I'm happy to recommend it.
Anonymous, US
The crisp, clean look of the graphics, and the fact that it allowed me to easily edit and change the colors to match the template was my main reason for purchasing them.
Brandie Jenkins, E-learning Developer, USA
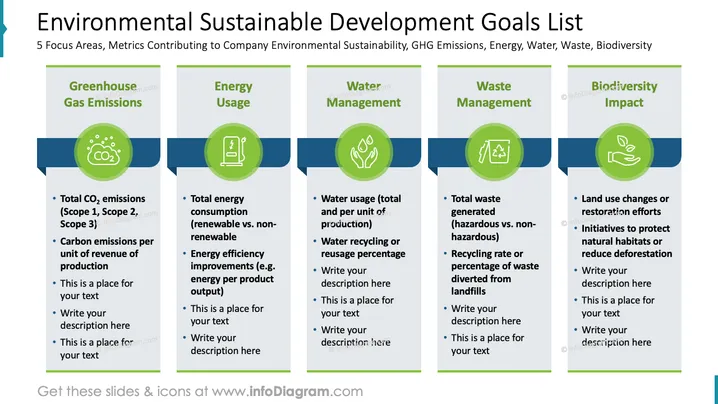
The slide outlines five focus areas contributing to environmental sustainability: Greenhouse Gas Emissions, Energy Usage, Water Management, Waste Management, and Biodiversity Impact. Each area includes key metrics. Greenhouse Gas Emissions detail CO2 levels and carbon emissions per production unit. Energy Usage focuses on energy consumption types and efficiency improvements. Water Management examines water usage and recycling. Waste Management considers the amount of waste generated and recycling rates. Biodiversity Impact looks at land use changes and environmental initiatives.
The slide provides a clear, structured overview of environmental sustainability goals. Each section is visually distinguished with consistent design elements, making it easy to follow.




