Your graphics add a nice touch to my presentations and I recently used them for one of my all-hands meetings. Your toolbox adds professionalism to my slides. Instead of using standard clipart.
Claude Jones, Director of Engineer, @Walmartlabs, USA
Your graphics add a nice touch to my presentations and I recently used them for one of my all-hands meetings. Your toolbox adds professionalism to my slides. Instead of using standard clipart.
Claude Jones, Director of Engineer, @Walmartlabs, USA
I needed a fresh look at some of my slides. I've tried to find a way to create a paintbrush effect, to underline, accentuate, add some color and the handwritten markers were just the things. Very easy to use, easy to size, change the color. It was an affordable, perfect solution and I'm happy to recommend it.
Anonymous, US
The crisp, clean look of the graphics, and the fact that it allowed me to easily edit and change the colors to match the template was my main reason for purchasing them.
Brandie Jenkins, E-learning Developer, USA
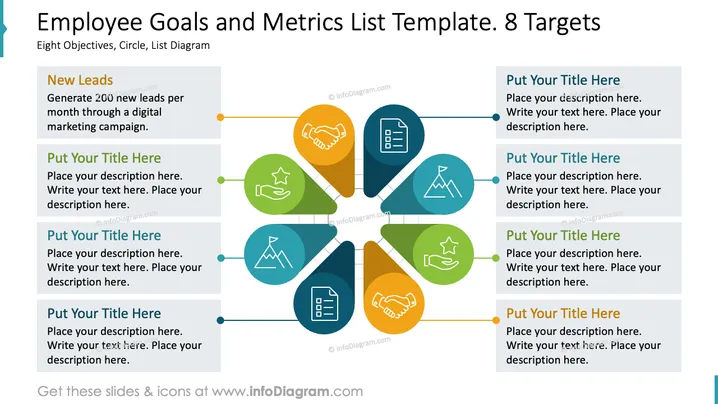
The slide is designed to outline eight separate goals or targets, each linked to a measurable metric. One example given is "New Leads," with the metric being the generation of 200 new leads per month through a digital marketing campaign. The other seven targets are left blank for the presenter to customize. The provision of example content and placeholders suggests the slide's focus on performance tracking and goal setting.
The visual composition is balanced and provides a clear and engaging format for presenting information. The icons within the teardrops are simple but distinct, facilitating quick understanding.


