Your graphics add a nice touch to my presentations and I recently used them for one of my all-hands meetings. Your toolbox adds professionalism to my slides. Instead of using standard clipart.
Claude Jones, Director of Engineer, @Walmartlabs, USA
Your graphics add a nice touch to my presentations and I recently used them for one of my all-hands meetings. Your toolbox adds professionalism to my slides. Instead of using standard clipart.
Claude Jones, Director of Engineer, @Walmartlabs, USA
I needed a fresh look at some of my slides. I've tried to find a way to create a paintbrush effect, to underline, accentuate, add some color and the handwritten markers were just the things. Very easy to use, easy to size, change the color. It was an affordable, perfect solution and I'm happy to recommend it.
Anonymous, US
The crisp, clean look of the graphics, and the fact that it allowed me to easily edit and change the colors to match the template was my main reason for purchasing them.
Brandie Jenkins, E-learning Developer, USA
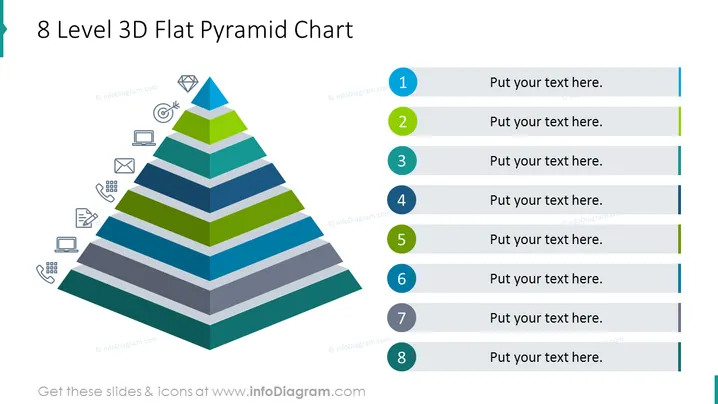
The PowerPoint slide showcases an "8 Level 3D Flat Pyramid Chart", organized to represent a hierarchy or a process with 8 distinct levels. Each level has a corresponding placeholder text for customization—"Put your text here." This setup allows for a clear visual distribution of information, with each level typically representing a distinct category or step in a process, progressing from the broad base to the narrow apex.
The slide has a modern and clean design with a balanced layout that allows for easy digestion of the information. The use of color to distinguish each level enhances the visual flow and facilitates understanding of the hierarchy or sequential process.


