Icons: Demographics Signs
Slide Content
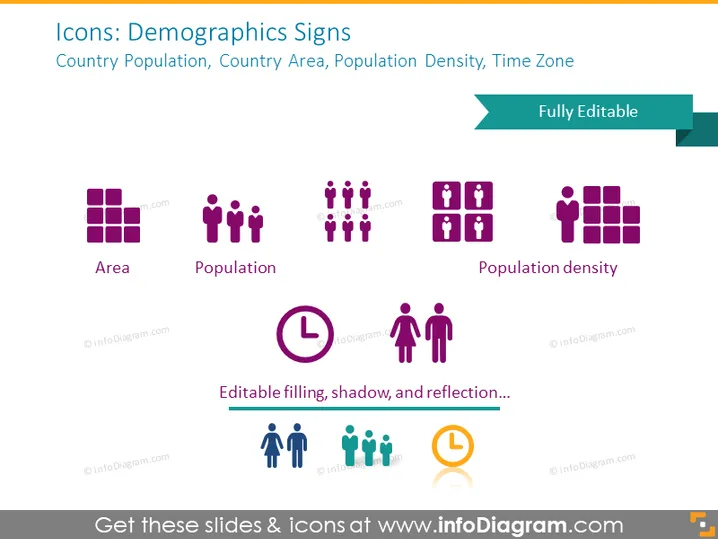
The PowerPoint slide is titled "Icons: Demographics Signs" and covers demographic topics such as Country Population, Country Area, Population Density, and Time Zone. It contains symbolic representations for each concept. "Area" shows a group of squares, likely indicating land plots. "Population" is represented by a group of figures, signifying a number of people. "Population density" combines the figures and squares to denote the concentration of individuals within a specific area. A mention of editable features like shadow and reflection is included, indicating these icons' customizable nature.
Graphical Look
- The slide background is plain and light-colored, providing high contrast for the icons and text.
- The title is at the top in large, bold text, with a colorful banner on the right side labeled "Fully Editable."
- Four sets of icons are displayed in a grid format, two per row, each accompanied by a label below in bold.
- The icons are stylized and minimalist, consisting of simple human figures and geometric shapes.
- Each icon set has a different color scheme, ranging from purple, light purple, to turquoise and orange.
- The bottom text emphasizes the editable characteristics of the icons, suggesting that users can change filling, shadow, and reflection.
- A decorative horizontal line separates the icon area from the text at the bottom.
The overall appearance of the slide is clean and professional with a straightforward layout that emphasizes clarity and ease of understanding. The color scheme is harmonious, and the use of bold, easy-to-read fonts ensures that the audience can quickly identify the icons and their labels.
Use Cases
- Presenting demographic data in a business plan or research report to visualize aspects like population size and population density.
- Educational purposes, such as teaching social science or statistics, where visual aids can enhance comprehension.
- Marketing presentations that require demographic segmentation to target different population groups.
- Public policy or urban planning proposals to illustrate considerations for population factors ## Icons: Demographics Signs
Slide Content
The PowerPoint slide, titled "Icons: Demographics Signs," showcases a collection of graphical representations for various demographic attributes: Country Population, Country Area, Population Density, and Time Zone. The "Area" is depicted as a group of squares indicating territorial layout, the "Population" by a cluster of human figures symbolizing the number of inhabitants, and "Population density" is shown as a denser aggregation of figures and squares indicating the number of people in relation to area size. The slide suggests that these icons have editable features, such as color filling, shadow, and reflection effects.
Graphical Look
- The slide has a clean white background, enhancing visibility and focus on the content.
- A bold, dark title text is positioned at the top of the slide, followed by a smaller subtitle listing demographic attributes.
- A teal-colored banner extends from the right edge of the slide near the title, indicating that the content is "Fully Editable."
- Four distinct icons occupy the central part of the slide: "Area," "Population," "Population density," and the representation of "Time Zone" (not mentioned but implied from the title); each has a descriptive label beneath it.
- Icons are stylized with a flat design aesthetic, utilizing solid fills and simple shapes to convey their respective concepts.
- There is a uniform visual style across the icons, with a purple-to-turquoise color gradient used throughout.
- A statement at the bottom edge of the slide highlights the icons' editable properties, set against a light-gray horizontal divider.
The slide exudes a modern and professional design, with a clear, organized layout that allows for quick information retrieval. The muted color palette and uniform iconography create a cohesive visual message that's easy on the eyes.
Use Cases
- Demonstrating regional or global demographic trends in a corporate or academic presentation.
- Visualizing statistical data in public health and urban planning strategies.
- Enhancing reports or inf ographics with clear visual elements to represent population metrics in market research.
- Engaging audiences during workshops or educational sessions about sociodemographics with easily interpretable visuals.