Your graphics add a nice touch to my presentations and I recently used them for one of my all-hands meetings. Your toolbox adds professionalism to my slides. Instead of using standard clipart.
Claude Jones, Director of Engineer, @Walmartlabs, USA
Your graphics add a nice touch to my presentations and I recently used them for one of my all-hands meetings. Your toolbox adds professionalism to my slides. Instead of using standard clipart.
Claude Jones, Director of Engineer, @Walmartlabs, USA
I needed a fresh look at some of my slides. I've tried to find a way to create a paintbrush effect, to underline, accentuate, add some color and the handwritten markers were just the things. Very easy to use, easy to size, change the color. It was an affordable, perfect solution and I'm happy to recommend it.
Anonymous, US
The crisp, clean look of the graphics, and the fact that it allowed me to easily edit and change the colors to match the template was my main reason for purchasing them.
Brandie Jenkins, E-learning Developer, USA
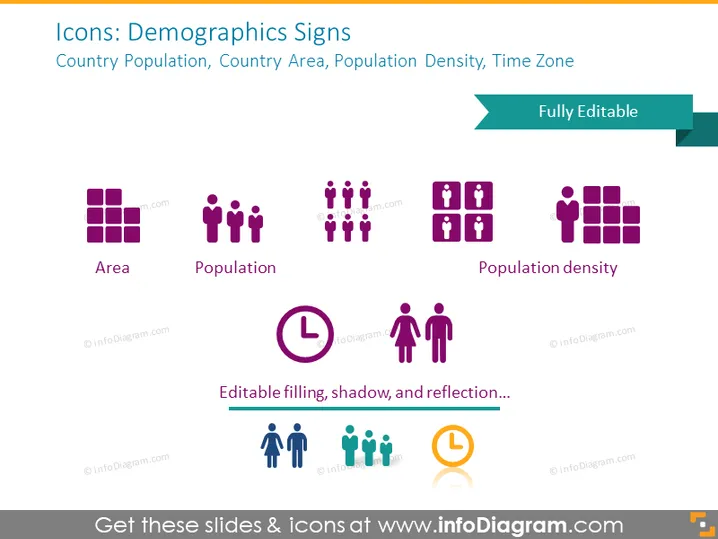
This PowerPoint slide displays a collection of icons that represent demographic metrics such as Country Population, Country Area, Population Density, and Time Zone. The icons are paired with labels to clarify what each signifies: "Area" is depicted by a grid of squares, representing geographic regions; "Population" is shown with multiple human figures, indicating a group of people; "Population Density" is symbolized by a dense cluster of human figures, illustrating the concept of many people living in a confined space; and there are also other icons not fully visible or labeled, likely referring to additional demographic data like Time Zone.
The slide has a modern and clean aesthetic, utilizing a simple color scheme and clear typography to emphasize the demographic icons. The visual composition is balanced, with a symmetrical arrangement of icons and text, making it visually appealing and easy to comprehend.


