Your graphics add a nice touch to my presentations and I recently used them for one of my all-hands meetings. Your toolbox adds professionalism to my slides. Instead of using standard clipart.
Claude Jones, Director of Engineer, @Walmartlabs, USA
Your graphics add a nice touch to my presentations and I recently used them for one of my all-hands meetings. Your toolbox adds professionalism to my slides. Instead of using standard clipart.
Claude Jones, Director of Engineer, @Walmartlabs, USA
I needed a fresh look at some of my slides. I've tried to find a way to create a paintbrush effect, to underline, accentuate, add some color and the handwritten markers were just the things. Very easy to use, easy to size, change the color. It was an affordable, perfect solution and I'm happy to recommend it.
Anonymous, US
The crisp, clean look of the graphics, and the fact that it allowed me to easily edit and change the colors to match the template was my main reason for purchasing them.
Brandie Jenkins, E-learning Developer, USA
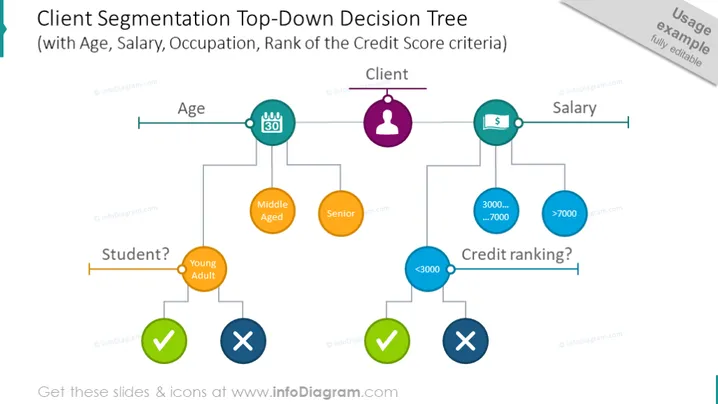
The PowerPoint slide presents a decision tree for client segmentation based on various criteria: age, salary, occupation, and credit score rank. Starting from the client, it splits into age categories (under 30, middle-aged, senior) and salary levels (less than 3000, between 3000 to 7000, and over 7000). Each node leads to further classification such as whether the individual is a student or not, and their credit ranking, with symbols representing successful or unsuccessful qualification at each decision point.
The slide is visually clean and structured, utilizing color-coded nodes and icons to represent a systematic approach to client segmentation. The decision tree format is clearly displayed to facilitate understanding of the segmentation process.


