

Your graphics add a nice touch to my presentations and I recently used them for one of my all-hands meetings. Your toolbox adds professionalism to my slides. Instead of using standard clipart.
Claude Jones, Director of Engineer, @Walmartlabs, USA

Your graphics add a nice touch to my presentations and I recently used them for one of my all-hands meetings. Your toolbox adds professionalism to my slides. Instead of using standard clipart.
Claude Jones, Director of Engineer, @Walmartlabs, USA
I needed a fresh look at some of my slides. I've tried to find a way to create a paintbrush effect, to underline, accentuate, add some color and the handwritten markers were just the things. Very easy to use, easy to size, change the color. It was an affordable, perfect solution and I'm happy to recommend it.
Anonymous, US
The crisp, clean look of the graphics, and the fact that it allowed me to easily edit and change the colors to match the template was my main reason for purchasing them.
Brandie Jenkins, E-learning Developer, USA
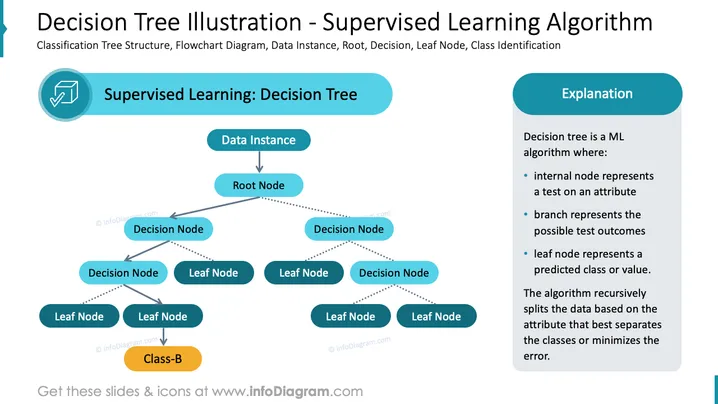
The slide presents a visual representation of a Machine Learning (ML) decision tree as part of supervised learning algorithms. It illustrates how data instances are classified through a series of decisions, leading to a predicted class. For clarity, the slide explains that decision trees consist of internal nodes representing tests on attributes, branches corresponding to test outcomes, and leaf nodes denoting predicted classes or values. The decision tree algorithm operates recursively, optimizing the classification by choosing the attribute that best separates the classes or minimizes the classification error.
The slide has a clean, professional design with a clear hierarchy of information and a balanced distribution of graphical and textual elements.



