Your graphics add a nice touch to my presentations and I recently used them for one of my all-hands meetings. Your toolbox adds professionalism to my slides. Instead of using standard clipart.
Claude Jones, Director of Engineer, @Walmartlabs, USA
Your graphics add a nice touch to my presentations and I recently used them for one of my all-hands meetings. Your toolbox adds professionalism to my slides. Instead of using standard clipart.
Claude Jones, Director of Engineer, @Walmartlabs, USA
I needed a fresh look at some of my slides. I've tried to find a way to create a paintbrush effect, to underline, accentuate, add some color and the handwritten markers were just the things. Very easy to use, easy to size, change the color. It was an affordable, perfect solution and I'm happy to recommend it.
Anonymous, US
The crisp, clean look of the graphics, and the fact that it allowed me to easily edit and change the colors to match the template was my main reason for purchasing them.
Brandie Jenkins, E-learning Developer, USA
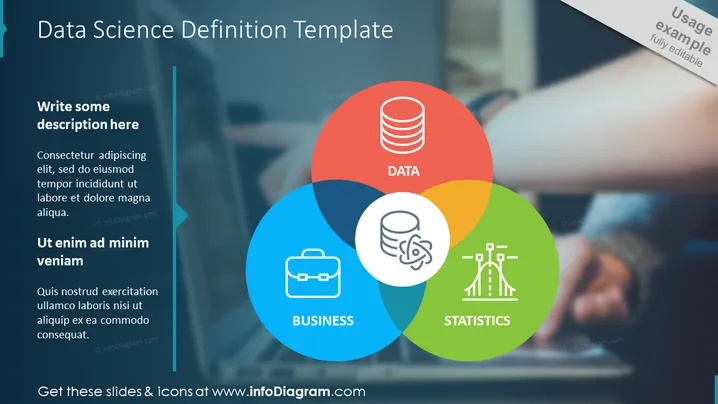
The PowerPoint slide provides a visual template for defining data science, which intersects three key areas: Data, Business, and Statistics. 'Data' represents the core substance of data science, encompassing the raw information to be analyzed. 'Business' implies the commercial context in which data science is applied, highlighting the importance of aligning with corporate goals. 'Statistics' is about the mathematical underpinnings that enable the analysis of data and the extraction of insights, crucial for informed decision-making.
The slide has a modern and engaging design that visually communicates the integration of data science components. The use of a Venn diagram over a real-world image effectively illustrates the conceptual overlap of data science with practical applications.


