Your graphics add a nice touch to my presentations and I recently used them for one of my all-hands meetings. Your toolbox adds professionalism to my slides. Instead of using standard clipart.
Claude Jones, Director of Engineer, @Walmartlabs, USA
Your graphics add a nice touch to my presentations and I recently used them for one of my all-hands meetings. Your toolbox adds professionalism to my slides. Instead of using standard clipart.
Claude Jones, Director of Engineer, @Walmartlabs, USA
I needed a fresh look at some of my slides. I've tried to find a way to create a paintbrush effect, to underline, accentuate, add some color and the handwritten markers were just the things. Very easy to use, easy to size, change the color. It was an affordable, perfect solution and I'm happy to recommend it.
Anonymous, US
The crisp, clean look of the graphics, and the fact that it allowed me to easily edit and change the colors to match the template was my main reason for purchasing them.
Brandie Jenkins, E-learning Developer, USA
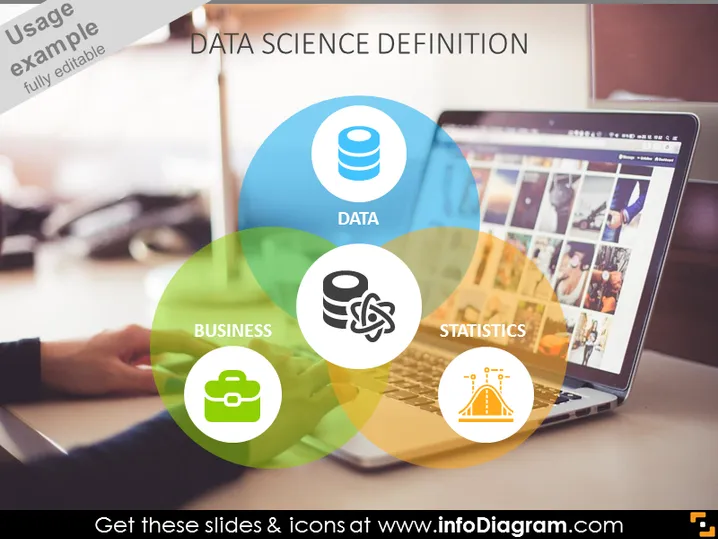
The slide is focused on defining the interdisciplinary field of Data Science. It breaks down the concept into three critical components: Data, illustrating the raw materials that data scientists work with; Business, signifying how data science applies to commercial and organizational contexts; and Statistics, indicating the mathematical foundation used for analyzing data. Each element signals how these domains intersect to create the realm of Data Science.
The slide presents a sleek and modern visual alignment, with a Venn diagram as the centerpiece to demonstrate the relationship between different aspects of Data Science. The use of transparency, color, and clean icons provides a visually engaging and easy-to-understand depiction of the subject matter.


