ICON INDEX — SYMBOLS ONLY
Slide Content
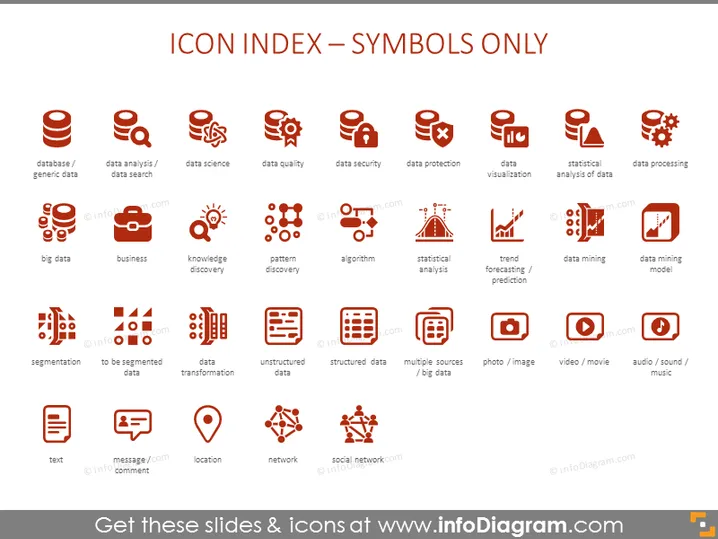
The PowerPoint slide is titled "ICON INDEX — SYMBOLS ONLY" and showcases various icons that represent different concepts related to data management and analysis. Each icon is labeled with a term that describes its intended use: "database / generic data" indicates a generic representation for databases, "data analysis / data search" suggests tools for examining and finding data, "data science" stands for the scientific methodologies applied to data, "data quality" highlights the importance of good data standards, "data security" emphasizes protecting data from unauthorized access, and "data protection" deals with safeguarding personal data legally. Other terms like "big data," "business," and "knowledge discovery" are self-explanatory, focusing on large data sets, commercial aspects, and uncovering new insights, respectively. "Pattern discovery," "algorithm," "statistical analysis," "trend forecasting / prediction," "data mining," and "data mining model" are analytical processes for finding patterns, devising computational instructions, performing statistical evaluations, predicting future tendencies, extracting useful information from large datasets, and constructing models for data mining. Technical processes such as "segmentation," "data transformation," "unstructured data," "structured data," and "multiple sources / big data" refer to dividing data into parts, converting data formats, dealing with data lacking predefined structure, organizing data into a defined format, and handling large volumes of data from various origins. Lastly, "text," "message/comment," "location," "network," "social network," and "photo / image," "video / movie," "audio / sound / music" icons relate to different types of content and ways in which information can be communicated or shared in digital formats.
Graphical Look
- The slide background is white with a red and grey color scheme for the icons and text.
- A title is centered at the top in large red font.
- A 4x6 grid layout is used to display the icons, with 24 icons in total.
- Each icon is paired with a small black descriptive label directly underneath it.
- Icons are monochromatic with a reddish tone and are designed in a flat graphic style.
- The icons all contain imagery pertinent to data management and analysis, such as databases, locks, charts, magnifying glasses, and more abstract representations like patterns and networks.
- Each row contains a variety of icons, indicating different themes or categories within the data field.
- The first row of icons includes representations for databases, data analysis, data science, and security-related themes.
- The second row includes representations for concepts such as pattern discovery and different types of analyses.
- Subsequent rows cover additional concepts, including data structure transformations and multiple types of media content.
The overall look of the slide is clean, professional, with a clear categorical distinction between icons. The consistent use of colors and styles provides a unified and visually appealing teaching or reference tool.
Use Cases
- This slide can be used in business presentations to explain different aspects of data management and analysis.
- It could serve as a visual aid in educational settings, such as workshops or courses on data science.
- The icons could act as a reference in a strategic planning meeting when discussing implementation of various data-related processes.
- This might be used in a technology overview to help stakeholders understand the tools and systems being employed or proposed.