Your graphics add a nice touch to my presentations and I recently used them for one of my all-hands meetings. Your toolbox adds professionalism to my slides. Instead of using standard clipart.
Claude Jones, Director of Engineer, @Walmartlabs, USA
Your graphics add a nice touch to my presentations and I recently used them for one of my all-hands meetings. Your toolbox adds professionalism to my slides. Instead of using standard clipart.
Claude Jones, Director of Engineer, @Walmartlabs, USA
I needed a fresh look at some of my slides. I've tried to find a way to create a paintbrush effect, to underline, accentuate, add some color and the handwritten markers were just the things. Very easy to use, easy to size, change the color. It was an affordable, perfect solution and I'm happy to recommend it.
Anonymous, US
The crisp, clean look of the graphics, and the fact that it allowed me to easily edit and change the colors to match the template was my main reason for purchasing them.
Brandie Jenkins, E-learning Developer, USA
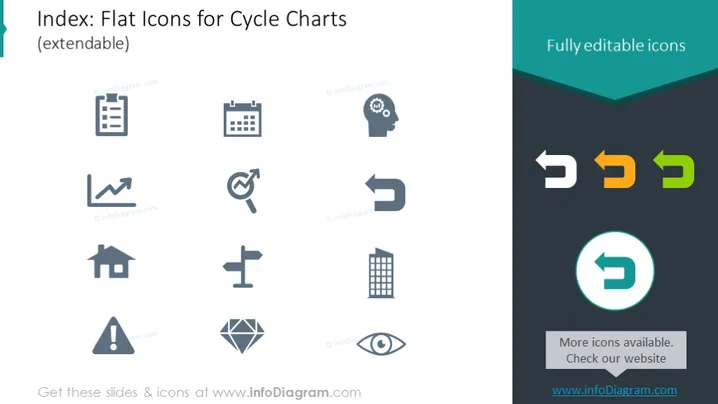
This PowerPoint slide presents a collection of flat icons specifically designed for use in cycle charts, indicating that the icons are extendable to suit different purposes. The slide offers a variety of icons such as a clipboard, calendar, gear with a light bulb, graph, target, directional circular arrow, house, signpost, warning triangle, and a diamond, which can represent diverse concepts like planning, scheduling, innovation, analytics, goals, processes, real estate, direction, caution, and value respectively.
The slide has a clean and modern design with a simple iconographic language. The contrasting colors help to differentiate between the available icons and draw attention to the editable feature of these graphics.


