Your graphics add a nice touch to my presentations and I recently used them for one of my all-hands meetings. Your toolbox adds professionalism to my slides. Instead of using standard clipart.
Claude Jones, Director of Engineer, @Walmartlabs, USA
Your graphics add a nice touch to my presentations and I recently used them for one of my all-hands meetings. Your toolbox adds professionalism to my slides. Instead of using standard clipart.
Claude Jones, Director of Engineer, @Walmartlabs, USA
I needed a fresh look at some of my slides. I've tried to find a way to create a paintbrush effect, to underline, accentuate, add some color and the handwritten markers were just the things. Very easy to use, easy to size, change the color. It was an affordable, perfect solution and I'm happy to recommend it.
Anonymous, US
The crisp, clean look of the graphics, and the fact that it allowed me to easily edit and change the colors to match the template was my main reason for purchasing them.
Brandie Jenkins, E-learning Developer, USA
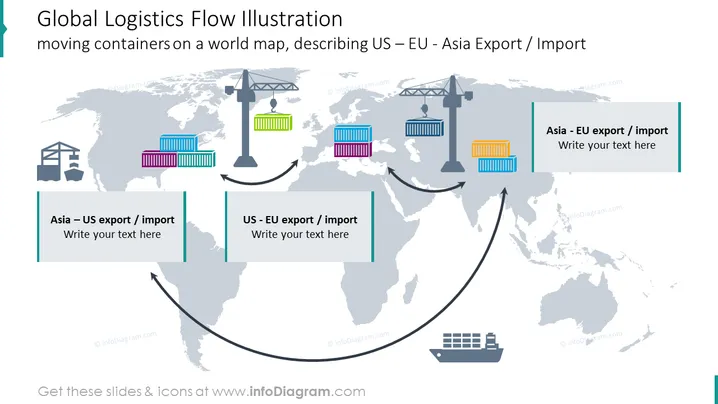
This slide, titled "Global Logistics Flow Illustration," depicts the movement of containers on a world map to describe the export and import processes among the US, EU, and Asia. Each trade route is represented by an arrow and is accompanied by a corresponding colored container symbol. The routes are Asia-US, US-EU, and Asia-EU. Text boxes below each route offer space for additional explanation about the nature of the trade exchange.
The slide features a clean, professional design with a gray color scheme accented by colored containers and highlighting. The graphics effectively convey a sense of global trade dynamics through visualization of logistics movements.


