

Your graphics add a nice touch to my presentations and I recently used them for one of my all-hands meetings. Your toolbox adds professionalism to my slides. Instead of using standard clipart.
Claude Jones, Director of Engineer, @Walmartlabs, USA

Your graphics add a nice touch to my presentations and I recently used them for one of my all-hands meetings. Your toolbox adds professionalism to my slides. Instead of using standard clipart.
Claude Jones, Director of Engineer, @Walmartlabs, USA
I needed a fresh look at some of my slides. I've tried to find a way to create a paintbrush effect, to underline, accentuate, add some color and the handwritten markers were just the things. Very easy to use, easy to size, change the color. It was an affordable, perfect solution and I'm happy to recommend it.
Anonymous, US
The crisp, clean look of the graphics, and the fact that it allowed me to easily edit and change the colors to match the template was my main reason for purchasing them.
Brandie Jenkins, E-learning Developer, USA
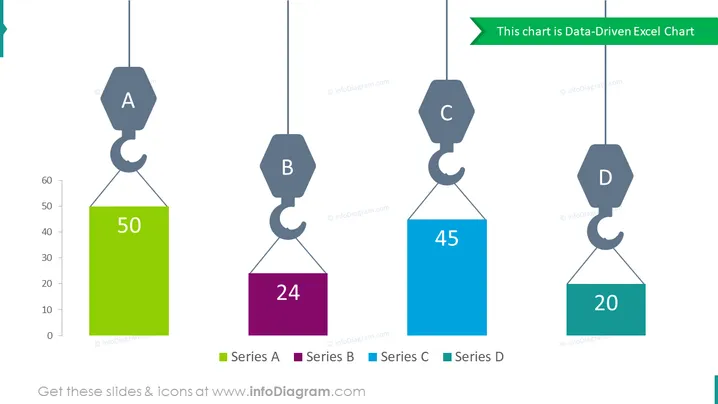
The PowerPoint slide presents a data-driven comparison chart, using cranes and weights to symbolize different data points for four series (A, B, C, and D). Numeric values are shown inside the weights, representing the magnitude of data for each series (50 for A, 24 for B, 45 for C, and 20 for D). Accompanying labels indicate the color coding for each series. This visual metaphor suggests a quantifiable measurement or assessment being "lifted" by the crane, with the implication that the heavier weights indicate greater numbers or metrics within the context of the data.
The slide design is clean and modern, with a creative use of crane graphics to represent weighted data. The graphical elements are simple yet effectively convey the concept of weighted measurements or comparisons.



